Figure I, web supplement
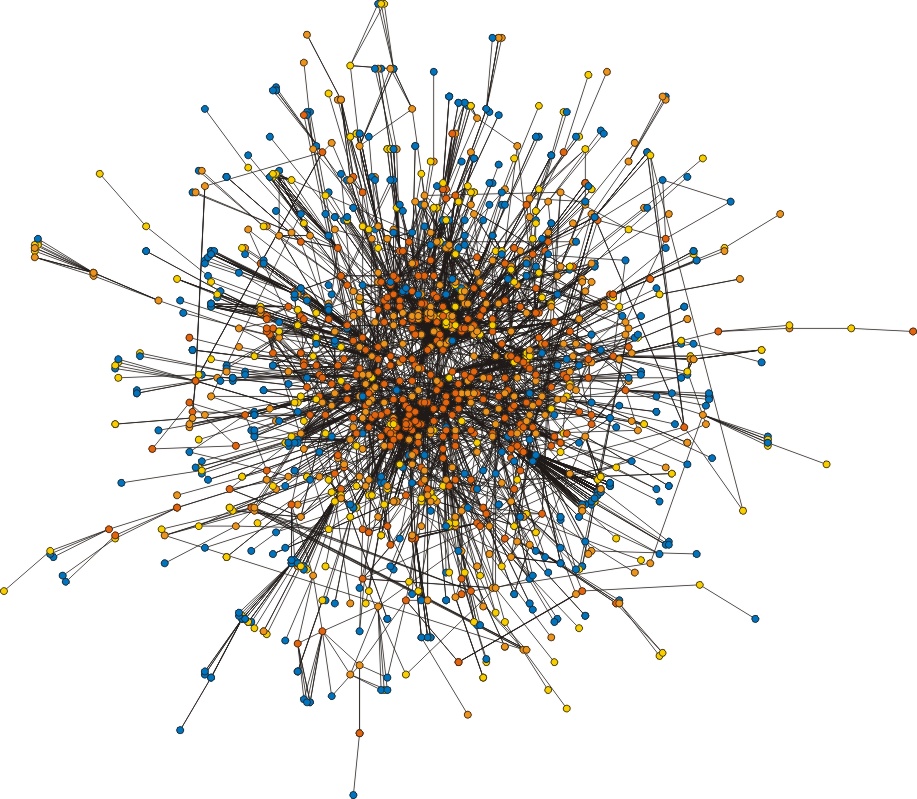 Figure I. The large cluster (1611 orthologous groups). The colors reflect
abundance. Orthologous groups which occur in 2 or 3 evolutionary distant1 species are blue, those who occur in 4 till 7 species are yellow,
those that occur in 8 till 15 species are orange,
while those in 16 or more species are red. The picture
was generated using the xgobi/xgvis package2 with parameters
default except that we scaled to 2 dimension instead of the default which
is 3. The data for this and other figures are based on analysis of the
genomes of the following species: Aeropyrum pernix, Aquifex aeolicus,
Archaeoglobus fulgidus, Bacillus halodurans , Bacillus subtilis, Borellia burgdorferi, Bunchera sp. APS, Campylobacter jejuni NCTC 11168, Chlamydia muridarum, Chlamydia pneumoniae, Chlamydia pneumoniae AR39, Chlamydia trachomatis D/UW-3/CX, Deinococcus radiodurans, Escherichia coli, Haemophilus influenzae, Halobacterium sp. NRC-1, Helicobacter pylori 26695, Helicobacter pylori J99, Methanococcus jannaschii, Methanobacterium thermoautotrophicum, Mycoplasma genitalium G37, Mycoplasma pneumoniae M129 , Mycobacterium tuberculosis Rv, Neisseria meningitidis MC58, Neisseria meningitidis Z2491, Pseudomonas aeruginosa PA01, Pyrococcus abbysii, Pyrococcus furiosus, Pyrococcus horikoshi, Rickettsia prowazekii, Saccharomyces cerevisiae, Synechocystis PCC6803, Thermoplasma acidophilum, Thermotoga maritima, Treponema pallidum, Ureaplasma urealyticum, Vibrio cholerae, and Xylella fastidiosa��
Figure I. The large cluster (1611 orthologous groups). The colors reflect
abundance. Orthologous groups which occur in 2 or 3 evolutionary distant1 species are blue, those who occur in 4 till 7 species are yellow,
those that occur in 8 till 15 species are orange,
while those in 16 or more species are red. The picture
was generated using the xgobi/xgvis package2 with parameters
default except that we scaled to 2 dimension instead of the default which
is 3. The data for this and other figures are based on analysis of the
genomes of the following species: Aeropyrum pernix, Aquifex aeolicus,
Archaeoglobus fulgidus, Bacillus halodurans , Bacillus subtilis, Borellia burgdorferi, Bunchera sp. APS, Campylobacter jejuni NCTC 11168, Chlamydia muridarum, Chlamydia pneumoniae, Chlamydia pneumoniae AR39, Chlamydia trachomatis D/UW-3/CX, Deinococcus radiodurans, Escherichia coli, Haemophilus influenzae, Halobacterium sp. NRC-1, Helicobacter pylori 26695, Helicobacter pylori J99, Methanococcus jannaschii, Methanobacterium thermoautotrophicum, Mycoplasma genitalium G37, Mycoplasma pneumoniae M129 , Mycobacterium tuberculosis Rv, Neisseria meningitidis MC58, Neisseria meningitidis Z2491, Pseudomonas aeruginosa PA01, Pyrococcus abbysii, Pyrococcus furiosus, Pyrococcus horikoshi, Rickettsia prowazekii, Saccharomyces cerevisiae, Synechocystis PCC6803, Thermoplasma acidophilum, Thermotoga maritima, Treponema pallidum, Ureaplasma urealyticum, Vibrio cholerae, and Xylella fastidiosa��
1. Snel, B., Lehmann, G., Bork, P., & Huynen, M. A. (2000) Nucleic Acids Res. 28, 3442-3444.
2. Kendall, M., & Stuart, A. 1977. In The advanced theory of statistics, Volume 1, Distribtuion theory. pp. 243-247. Charles Griffin & Company Ltd. London/
Berend Snel
Last modified: Mon Feb 18 13:24:39 MET 2002