
Overview
Preparation
Download the and extract the tutorial
Download the tutorial files here and then extract them:
~/downloads/>tar -zxf sircah_tutorial.tar.gz
~/downloads/>cd sircah_tutorial
~/sircah_tutorial/>ls -ltr
-rw-r--r-- 1 user group 9352  2008-02-10 13:29 tutorial_genome_annotation.gff
-rw-r--r-- 1 user group 21509 2008-02-10 13:29 tutorial_matches.gff
The file tutorial_genome_annotation.gff contains the ENSEMBL annotation of the myosin VI gene in the GFF3:
6 ensembl gene ...  ID=ENSG00000196586;description="Myosin-6 (Myosin VI)"
6 ensembl mRNA	... ID=ENST00000369985;Parent=ENSG00000196586;ORF=ENSP00000359002 76583985 76681449
6 ensembl exon ... ID=ENSE00001027384;Parent=ENST00000357181,ENST00000369977;
...6 GMAP cDNA_match ... ID=L29145.1;Gap=M62 D2953 M56 D4628 M98 D531 M45;
...
6 GMAP EST_match ... ID=BQ890401.1;Tags=Nervous System;Gap=M73 D531 M845;Add the alignments to the genes
Before we use sircah to detect alternative splicing we need to match up the EST and cDNA alignments in tutorial_matches.gff to the gene annotation in tutorial_genome_annotation.gff (if you don't have annotated genes you can use sircah_cluster_alignments.py to cluster the alignments into genes). The script sircah_add_alignments_to_genes.py looks for overlapping nucleotides between the exons of the gene and the alignments:
~/sircah_tutorial/>sircah_add_alignments_to_genes.py -g tutorial_genome_annotation.gff\
-a tutorial_matches.gff -o sircah_input.gff
searching for overlaps between 1 genes and 99 alignments (99 comparisons).
99 alignments overlap
In this case all the alignments overlap the gene and if we look at the output gff file sircah_input.gff we can see that the Parent attribute of all of these alignments has been set to the gene id:
6 GMAP EST_match ... ID=BQ890401.1;Parent=ENSG00000196586;Tags=Nervous System;Gap=M73 D531 M845;Detect alternative splicing and transcription
Specifying an output format
Before we run the detection step we first need to decide how we're going to store the results. Currently Sircah can store the results either in a local file in either XML-formatted text or an sqlite3 database, alternatively the results can be stored on either a MySQL or PostgreSQL server. The choice of output format is specified with the --output_url parameter. This URL takes the form
driver://user:pass@host:port/database_nameIf you only intend to use the file-based output then the URL is relatively simple, you only need to specify either a relative or absolute path to the file that you want to create:
sqlite:///sircah_tutorial.db #relative path
sqlite:////home/sircah_user/sircah_tutorialsircah_tutorial.db #absolute path
xml:///sircah_tutorial.xml #relative path
xml:////home/sircah_user/sircah_tutorialsircah_tutorial.xml #absolute path
If you want to store your results in either a MySQL or PostgreSQL database you first need to set up the databases. These databases use a client-server model for database access, and in order to create and alter databases you need to have the correct privileges to do so. For the purposes of this tutorial we'll assume that there is an account with the username sircah_user with the password sircah_pwd that can create databases. If you don't already have such an account, please consult the MySQL or PostgreSQL documentation to see how to create one.
To create a MySQL database for the tutorial you can type the following at the command-line:
~/sircah_tutorial/>mysql -usircah_user -psircah_pwd -e 'CREATE DATABASE sircah_tutorial'
substituting sircah_tutorial for the name of the database that you want to create. This database can now be accessed using the URL mysql://sircah_user:sircah_pwd@localhost/sircah_tutorial.
Similarly to create the PostgreSQL database you can type the following command:
~/sircah_tutorial/>createdb -usircah_user -W sircah_tutorial
and enter sircah_pwd at the prompt. This database can now be accessed with the URL postgres://sircah_user:sircah_pwd@localhost/sircah_tutorial. For information on how to pass arguments to these database connections please consult the SQLAlchemy documentation For this tutorial we'll be using the URL xml:///sircah_tutorial.xml, creating an XML file in the local directory, but you can substitute an alternative URL if you want.
Run sircah_detect.py
In order to detect alternative splicing and transcription events we need to run the sircah_detect.py script:
~/sircah_tutorial/>sircah_detect.py -g sircah_input.gff -u xml:///sircah_tutorial.xml
Visualise alternative splicing and transcription events
Standard visualisation
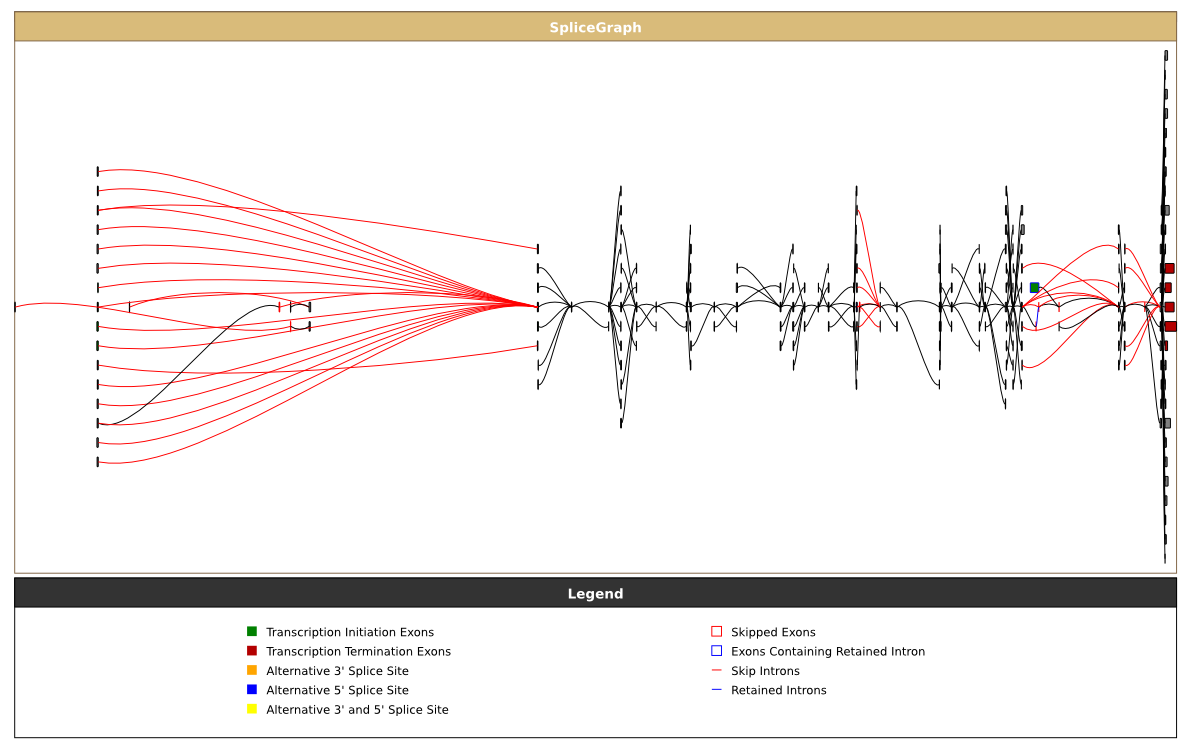
If you run sircah_visualise.py with the default values you will create a graph where the introns and exons are coloured according to the type of alternative splicing or transcription event they're involved in:
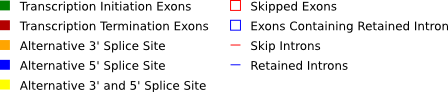
The legend displaying the colouring of the different alternative splicing events detected by Sircah
~/sircah_tutorial/>sircah_visualise.py -u xml:///sircah_tutorial.xml
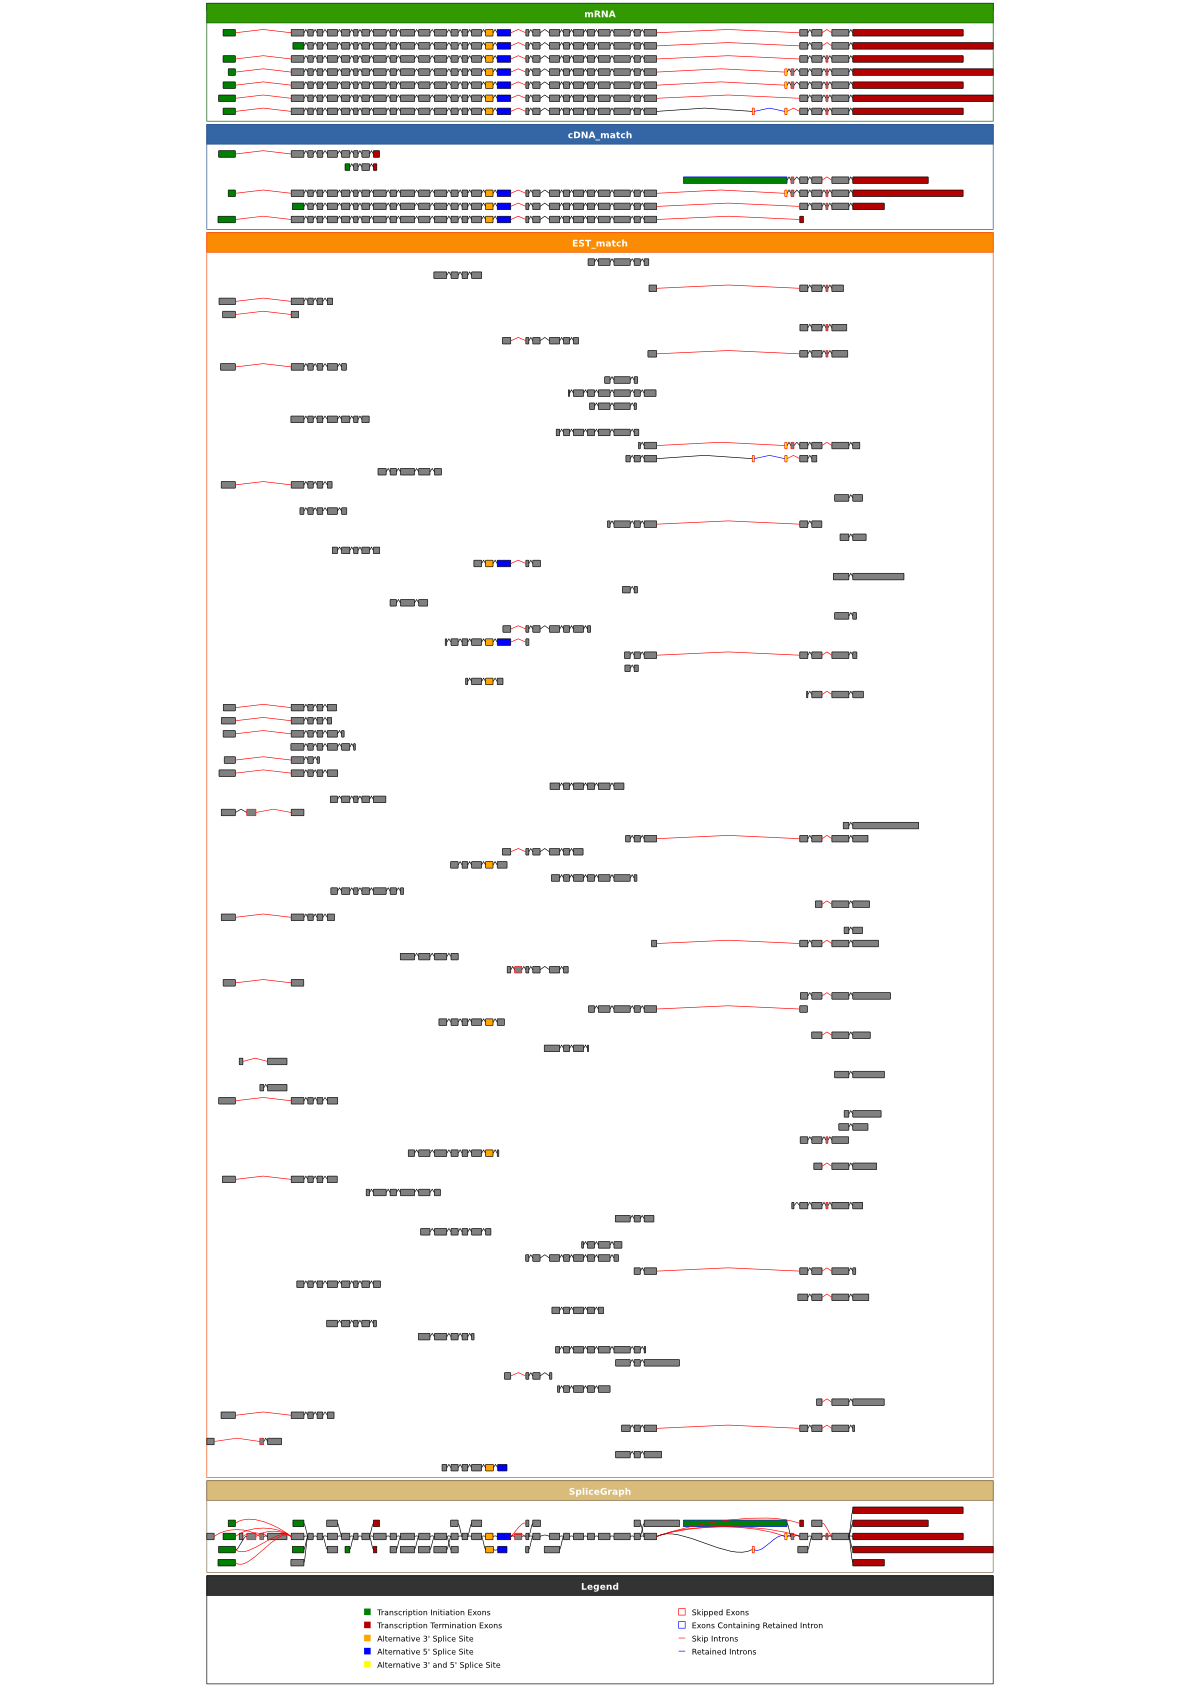
will create a file ENSG00000196586.svg with a graph that looks like this. It shows all of the alignments and the resulting splicgraph coloured according to the the type of alternative splicing event that they are involved in. The EST alignments take up much of the figure and make it difficult to see what's going on, you can turn off the EST alignment track by using the --evidence_types flag:
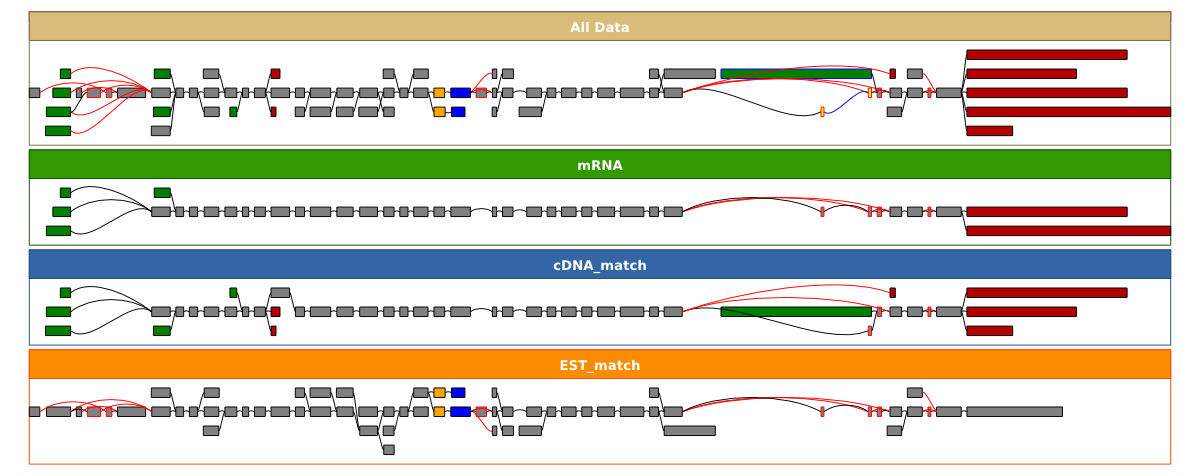
~/sircah_tutorial/>sircah_visualise.py -u xml:///sircah_tutorial.xml -e cDNA_match -e mRNA\
            -s _EST_track_off
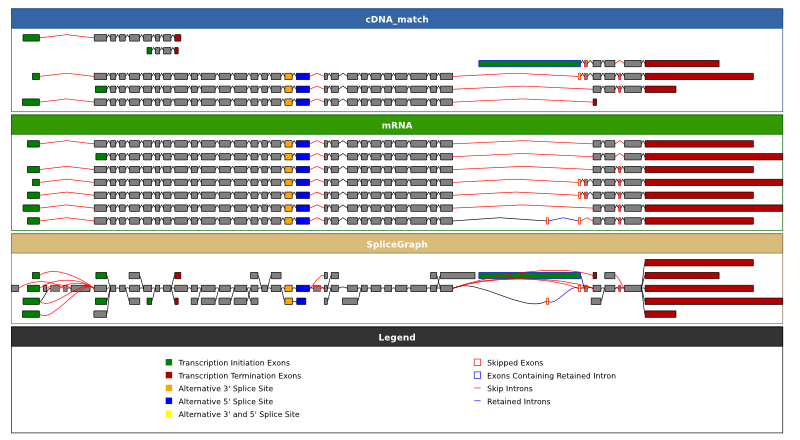
creating a file ENSG00000196586_EST_track_off.svg with this graph. Both of these graphs trim long introns to facilitate visualisation, to view the sizes of introns proportional to their length in the genome you can use the -p option:
~/sircah_tutorial/>sircah_visualise.py -u xml:///sircah_tutorial.xml -e cDNA_match -e mRNA\
            -s _EST_track_off_proportional -p
the results of which can be seen here. For the puroposes of display, the splicegraph merges unbounded exons (the aligment is incomplete and therefore the exact boundary of the exon cannot be determined), if you want to want to view the unmerged exons you can use the -b flag to produce this graph:
~/sircah_tutorial/>sircah_visualise.py -u xml:///sircah_tutorial.xml -s _unbounded -E -b
Compare the alternative splicing events seen in subsets of the data
Often you will want to see what alternative events are detected in a particular subset of the input data you can create a filter graph. In this case Sircah creates a splicegraph using only a subset of the evidence and detects alternative splicing and transcription events in this subset of data. For instance to create a filter graph based on evidence types you can run the command:
~/sircah_tutorial/>sircah_visualise.py -u xml:///sircah_tutorial.xml -s _filter_evidence -t filter_evidence
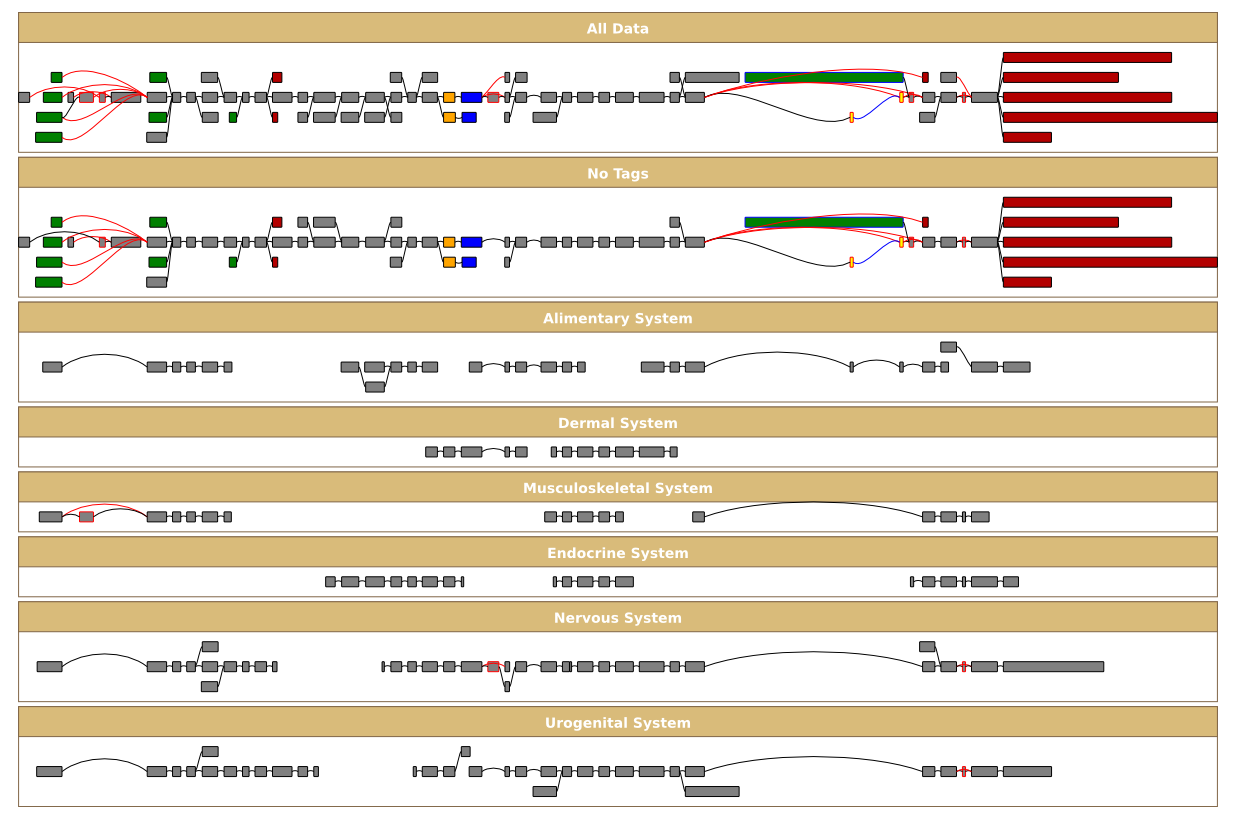
which creates this graph. A more useful type of filter graph uses the tags specified in the input gff file:
6 GMAP EST_match ... ID=BQ890401.1;Tags=Nervous System;Gap=M73 D531 M845;These tags allow you to define arbitrary subsets of data, to look at alternative splicing in different contexts. For instance, the EST alignments in the tutorial input file are tagged with tissue terms from the EVOC expression ontology. To view the different alternative splicing events in these tissues we can run the commmand:
~/sircah_tutorial/>sircah_visualise.py -u xml:///sircah_tutorial.xml -s filter_tags -t filter_tags
which gives us this graph.
View the coverage of different exons and introns
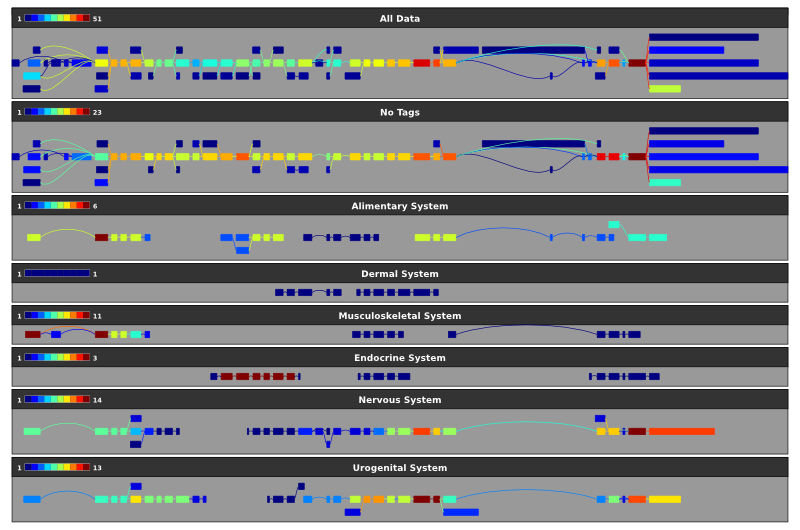
As we saw with the first graph above that displaying too many alignments can make the visualisation unwieldy. The splicegraph representation overcomes this by removing the redundancy in the alignments at the expense of being able to determine how many alignments support a particular event. By selecting the coverage_level colour scheme you can colour the exons and introns according to the number of alignments/mRNAs that they are seen in:
~/sircah_tutorial/>sircah_visualise.py -u xml:///sircah_tutorial.xml -s filter_tags_coverage\
            -t filter_tags -C coverage_level
The resulting graph can be seen here, the colour scale for each splicegraph is shown in the top left corner of each track.


