STEP 18
For all datasets considered for the ROC-analysis (Step 19), the distribution of Pearson correlation coefficients for protein-protein pairs with STRING interaction score > 700 (combined score), known interaction (combined score >0) and random protein-protein pairs is analyzed. The Mann-Whitney U-test was used to assess significance of the respective shifts.
Proteome data published in Martin-Perez & Judit Villén(2017), Cell Systems
yeast4_quant_Proteome_naclStress_MAPPED_complexes_pathways_NORM2.tsv.gz (179KB)Proteome data published in Martin-Perez & Judit Villén(2017), Cell Systems
yeast5_quant_Proteome_MAPPED_complexes_pathways_NORM2_IBAQ.tsv.gz (301KB)Proteome data published in Skelly et al.(2013), Genome Research; re-analyzed with MaxQuant
yeast10_quant_RNA_MAPPED_complexes_pathways_NORM2.tsv.gz (568KB)RNA-seq data published in Lahtvee et al.(2017), Cell Systems
yeast11_quant_proteome_MAPPED_complexes_pathways_NORM2.tsv.gz (208KB)Proteome data published in Lahtvee et al.(2017), Cell Systems
yeast14_quant_proteome_MAPPED_complexes_pathways_NORM2.tsv.gz (282KB)Proteome data published in Picotti et al.(2013), Nature
yeast16_quant_proteome_MAPPED_complexes_pathways_NORM2.tsv.gz (120KB)Proteome data published in Pavelka et al.(2010), Nature
yeast18_quant_proteome_MAPPED_complexes_pathways_NORM2.tsv.gz (140KB)Proteome data published in Janssens et al.(2015), Elife
yeast19_quant_transcriptome_MAPPED_complexes_pathways_NORM2.tsv.gz (520KB)RNA-seq data published in Janssens et al.(2015), Elife
yeast20_quant_proteome_MAPPED_complexes_pathways_NORM2.tsv.gz (248KB)Proteome data published in Varland et al.(2018), Molecular & Cellular Proteomics
yeast21_quant_proteome_MAPPED_complexes_pathways_NORM2_REP.tsv.gz (258KB)Proteome data published in Zelezniak et al.(2018), Cell Systems
4932.STRING.data.zip (37.5MB)STRING data (v10.5) extracted for yeast
Download all input files here. (40MB)Recovery of known STRING interactions in different published yeast datasets.
Python object containing correlation values for all protein pairs (STRING and others) for each of the yeast datasets; unzip and unpickle to open.
suppFigure1_additional_yeast.png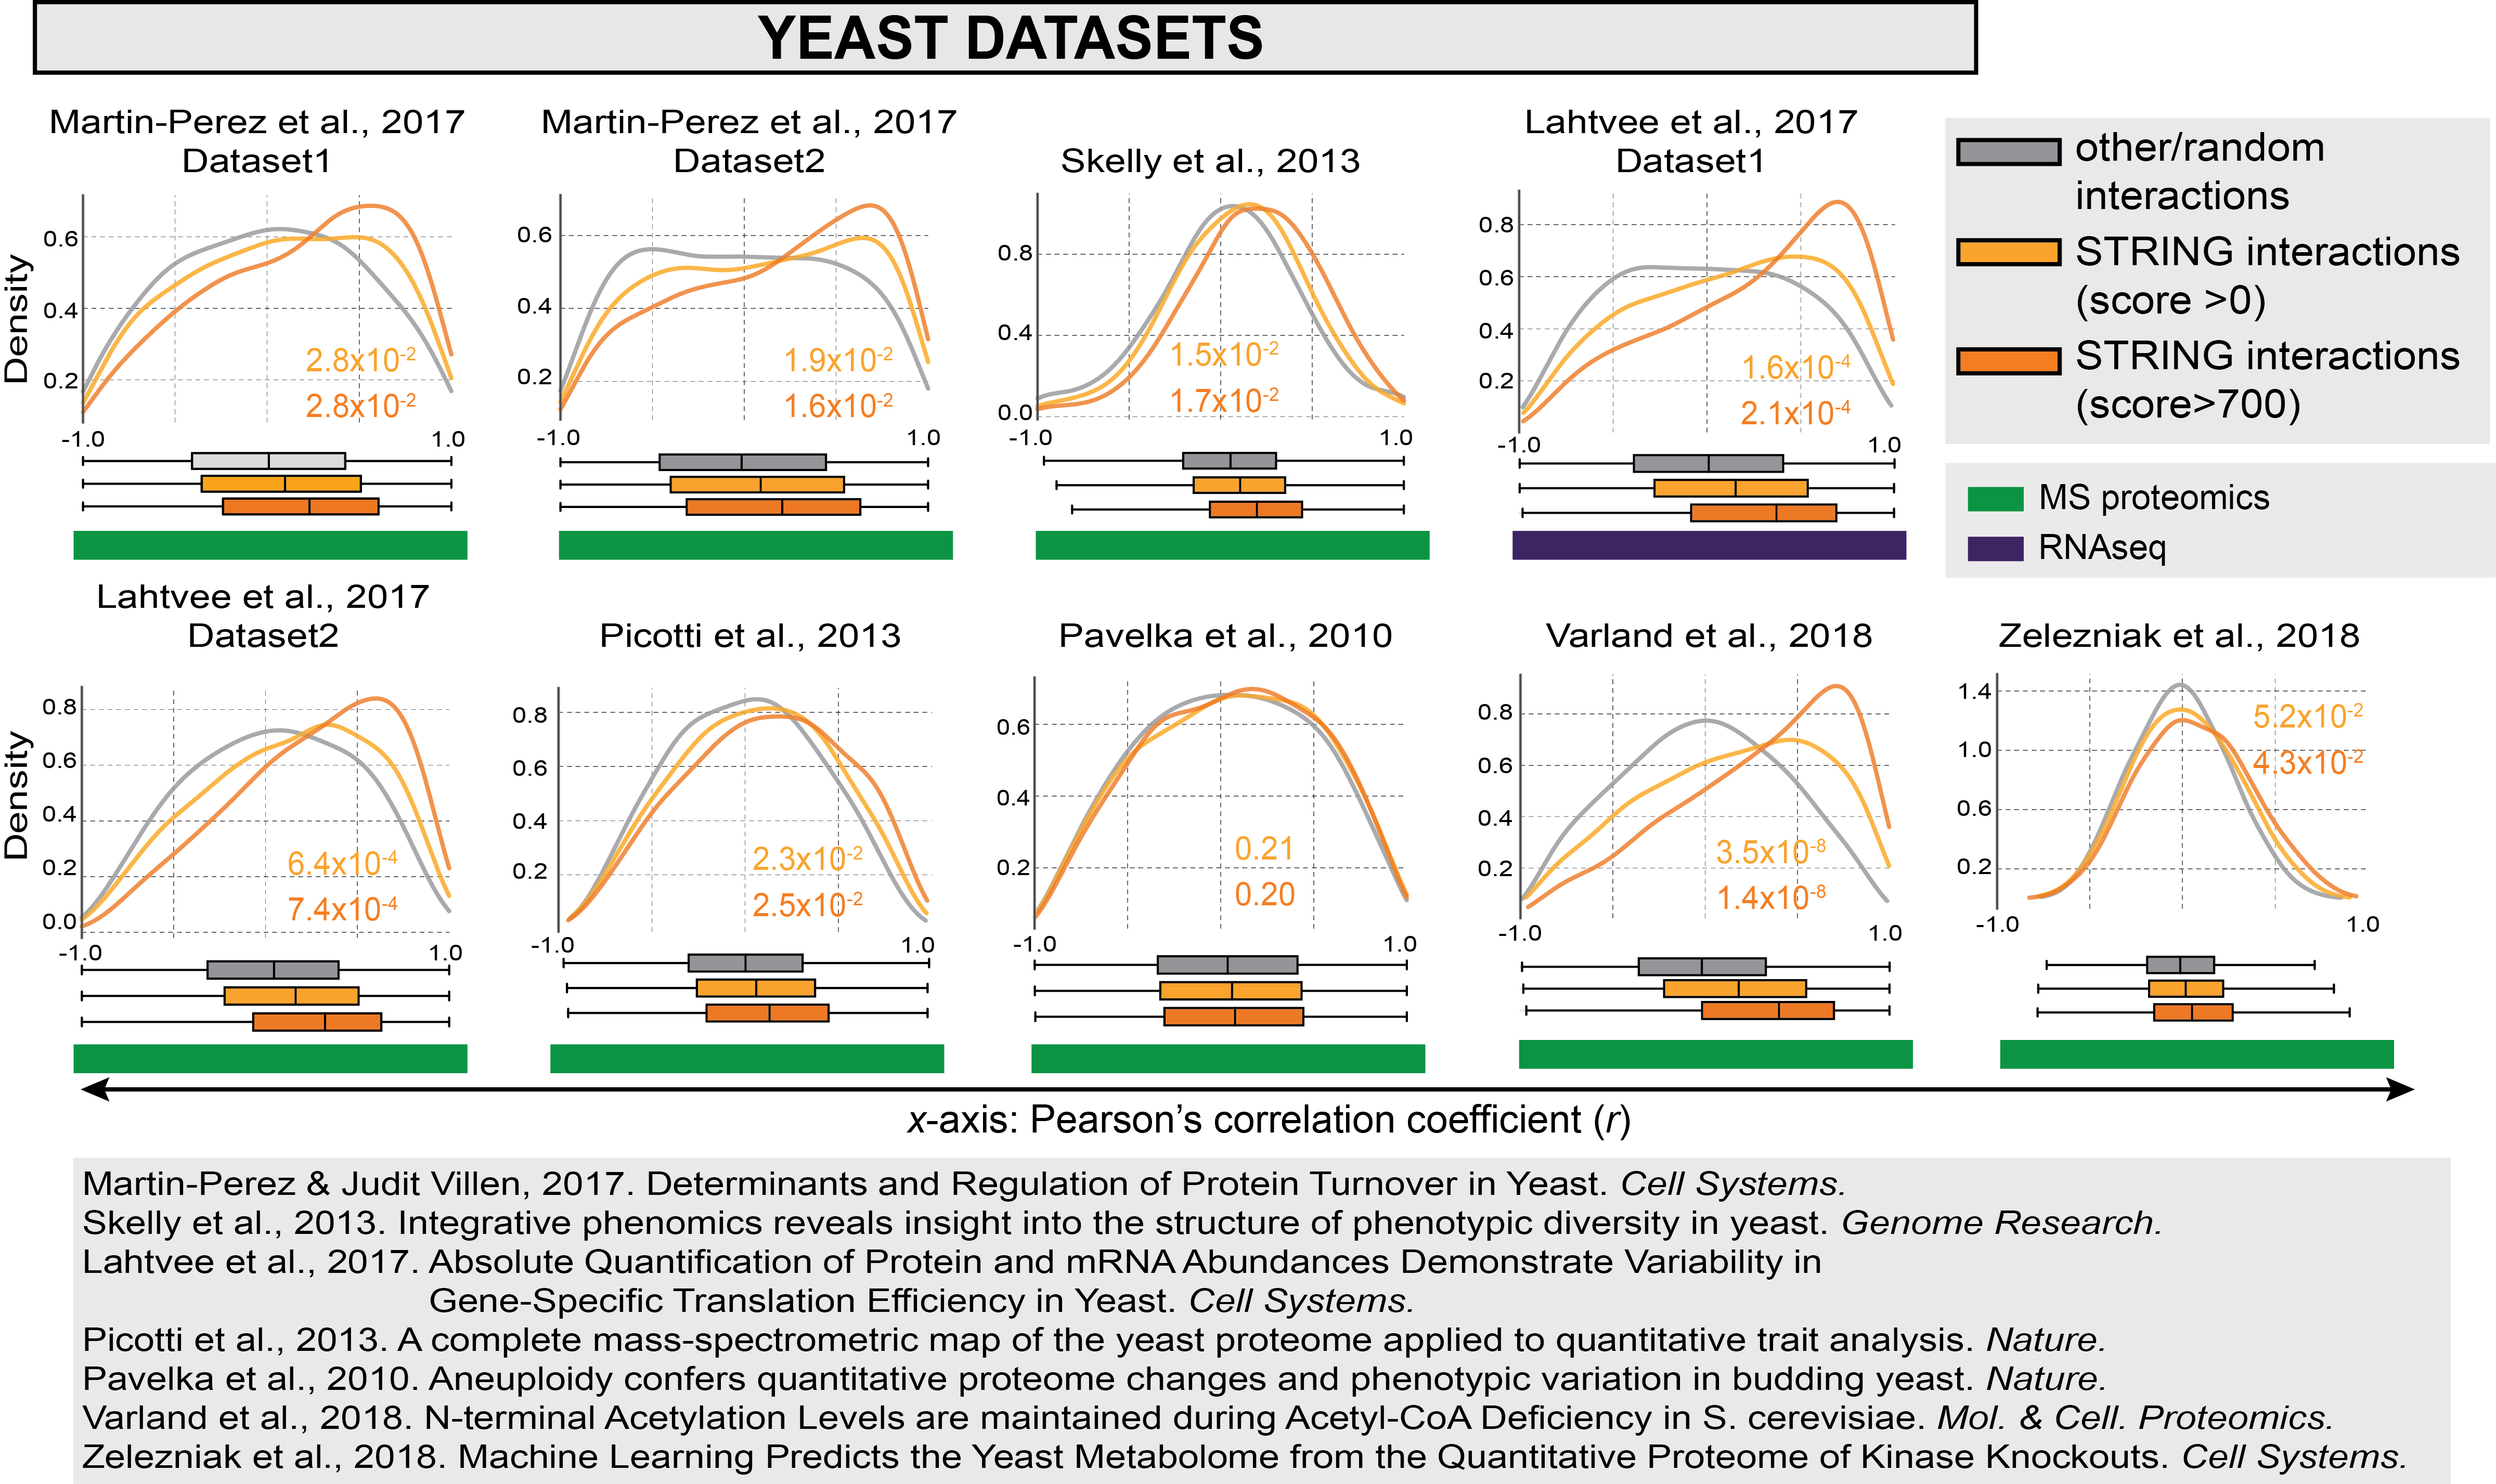
Density plots displaying correlation values for STRING interactors.