STEP 19
Additionally to the proteomic datasets derived from mammalian organisms, we also analyzed published MS-datasets of yeast proteomes and their corresponding RNA-seq datasets if available. A total of eight independent publications were considered: (i) Martin-Perez & Judit Villen (2017), Cell Systems, (ii) Skelly et al. (2013), Genome Research, (iii) Lahtvee et al. (2017), Cell Systems, (iv) Picotti et al. (2013), Nature, (v) Pavelka et al. (2010), Nature, (vi) Varland et al. (2018), Mol Cell Proteomics, (vii) Zelezniak et al. (2018), Cell Systems, (viii) Janssens et al. (2015), elife. 11 datasets derived from these publications (Supplementary Table S6) were quantile-normalized and filtered according to their potential to recover known protein-protein interactions based on co-variation (Figure S6A; see Step6).
Python object containing correlation values for all protein pairs (STRING and others) for each of the yeast datasets; unzip and unpickle to open.
housekeeping_genes.txt (70KB)Housekeeping genes as defined by Eisen & Levanon (2013), Trends in Genetics
essentiality_genes.txt (1.5MB)Essential genes as defined by Wang et al.(2015),Science
subcellular_location.csv (1.5MB)Subcellular location (as a proxy in this case) as defined by the Human Protein Atlas (Uhlen et al.(2015),Science)
orf_coding_all_R64-2-1_20150113.fasta (11.5MB)The S288C reference genome
AUC-matrix showing the strongest co-variation across individuals stems from protein complexes.
wp_step19_code_auc_preparation.pyAUC calculation (long script)
Underlying data for ROC calculation for yeast datasets. Underlying data for Supplementary Figure S6.
suppFigure2_additional_yeast.png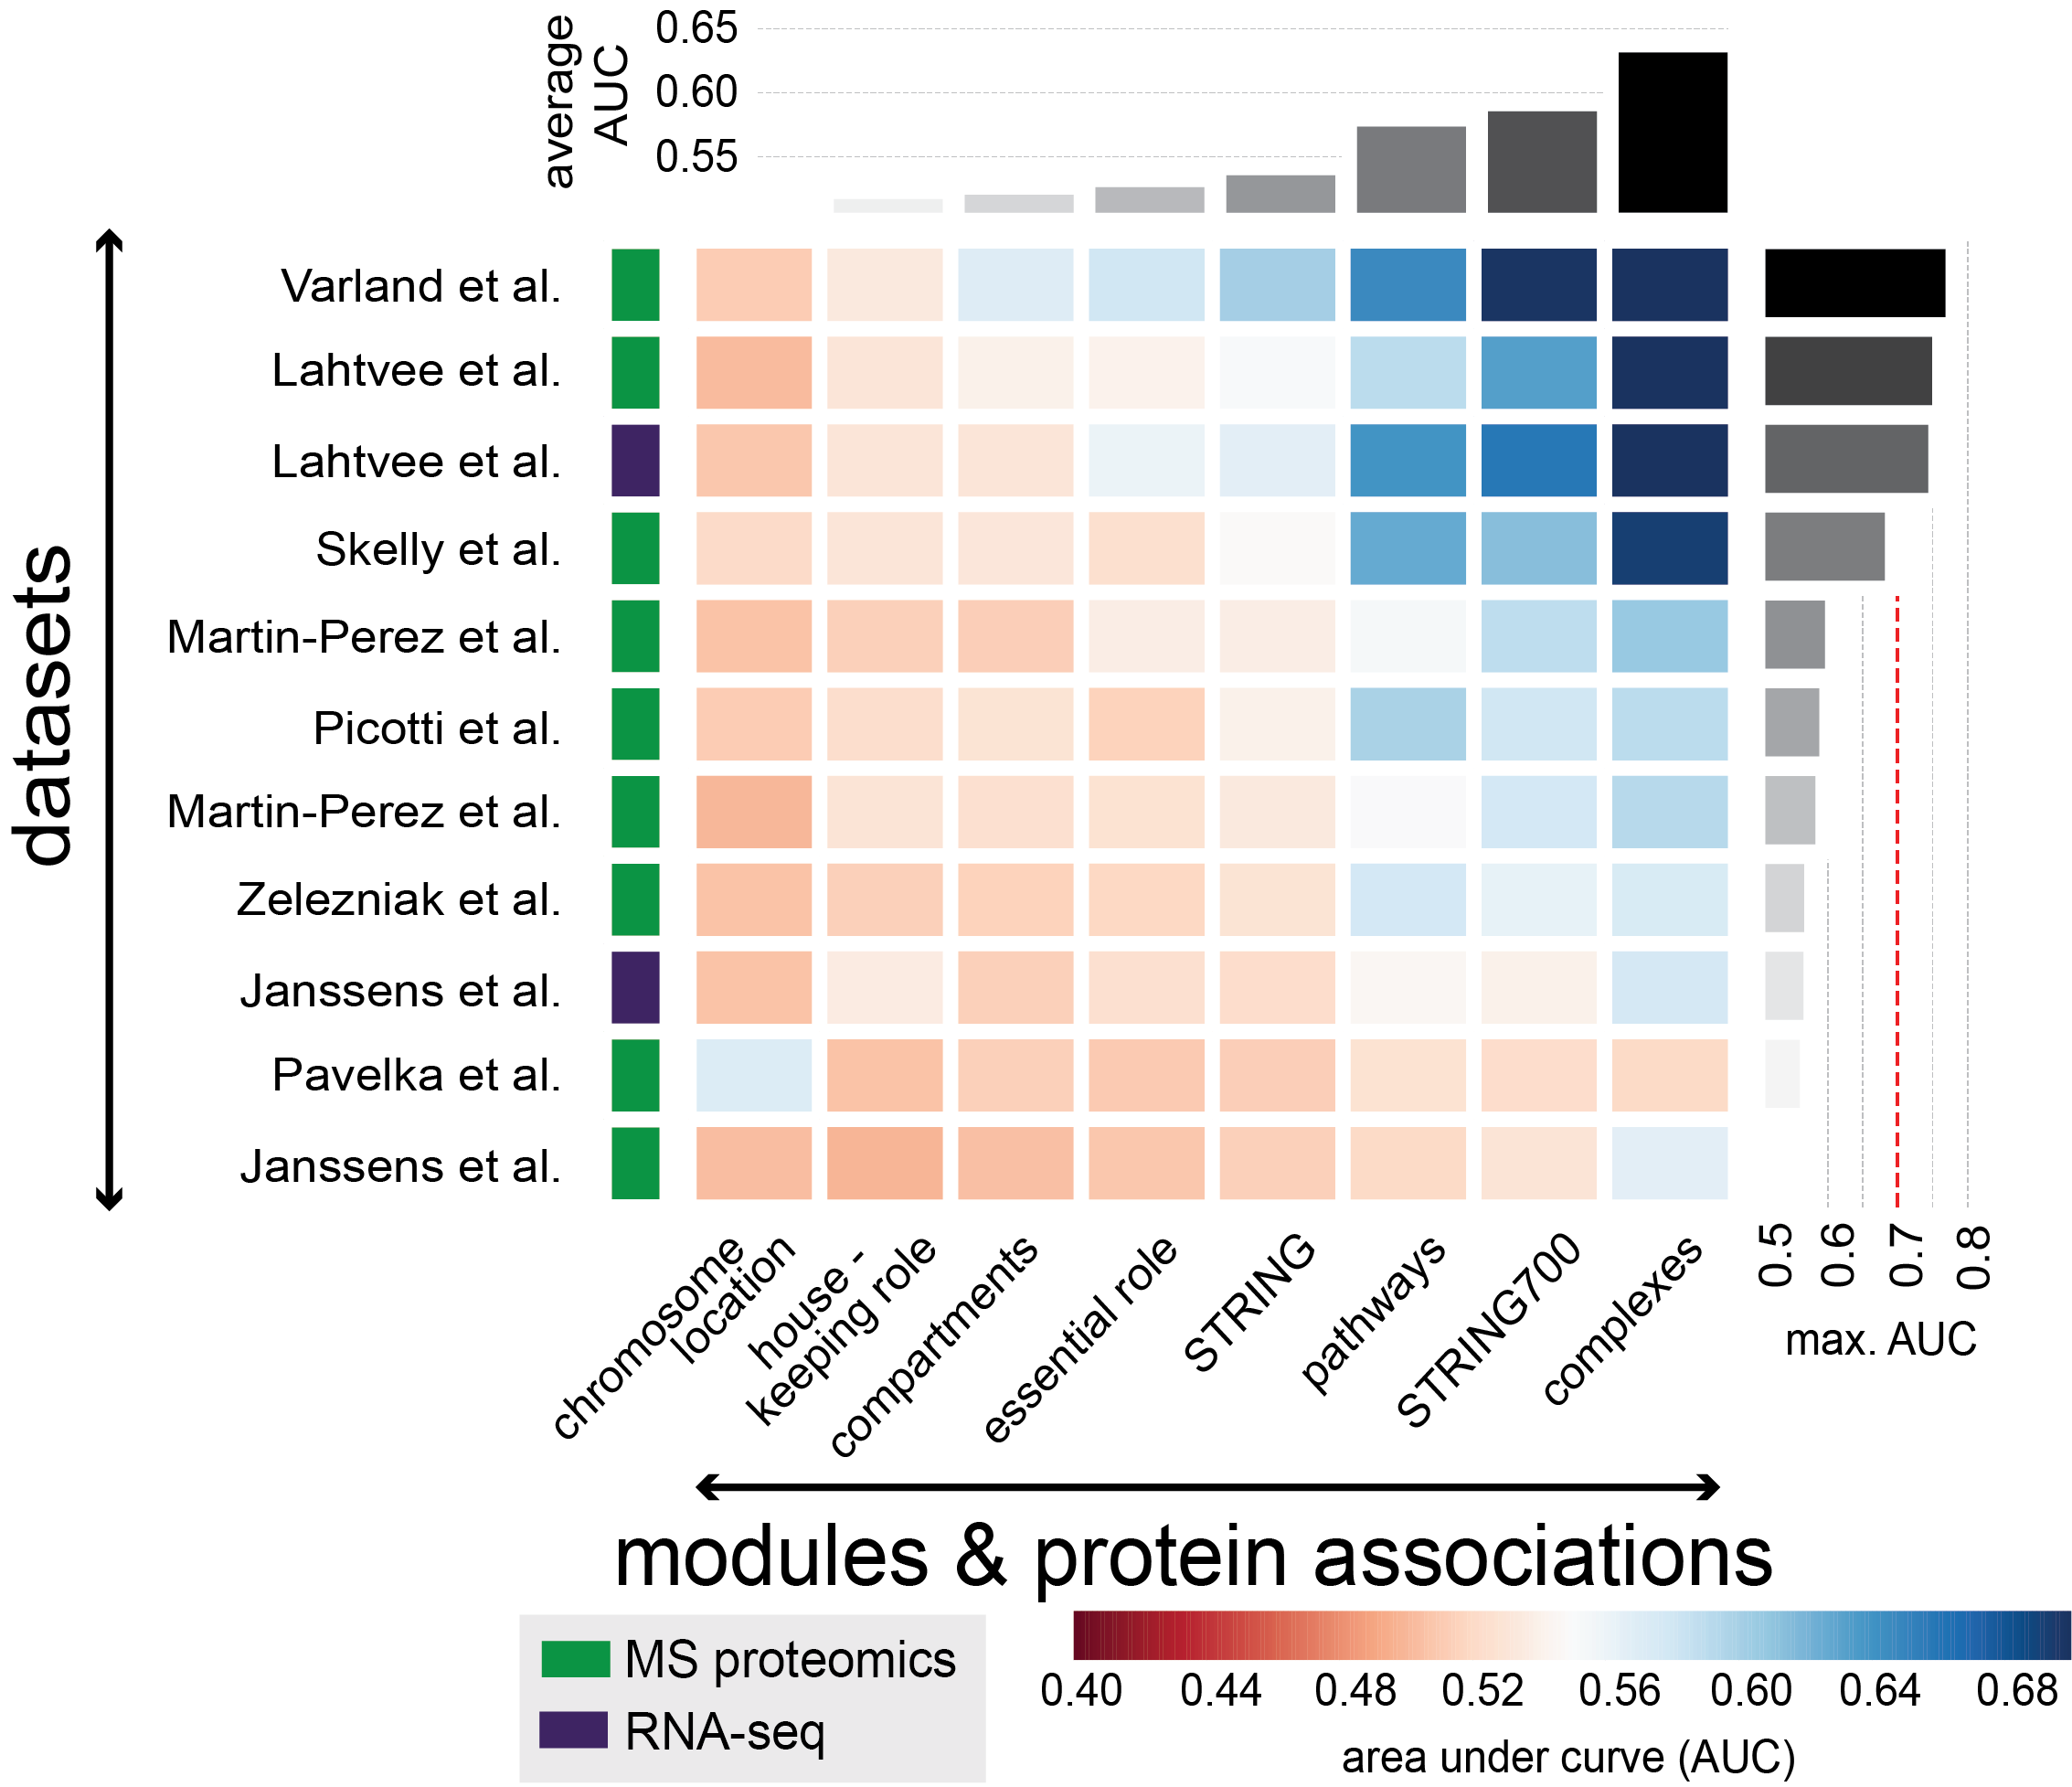
AUC matrix on co-variation.