Figure 1
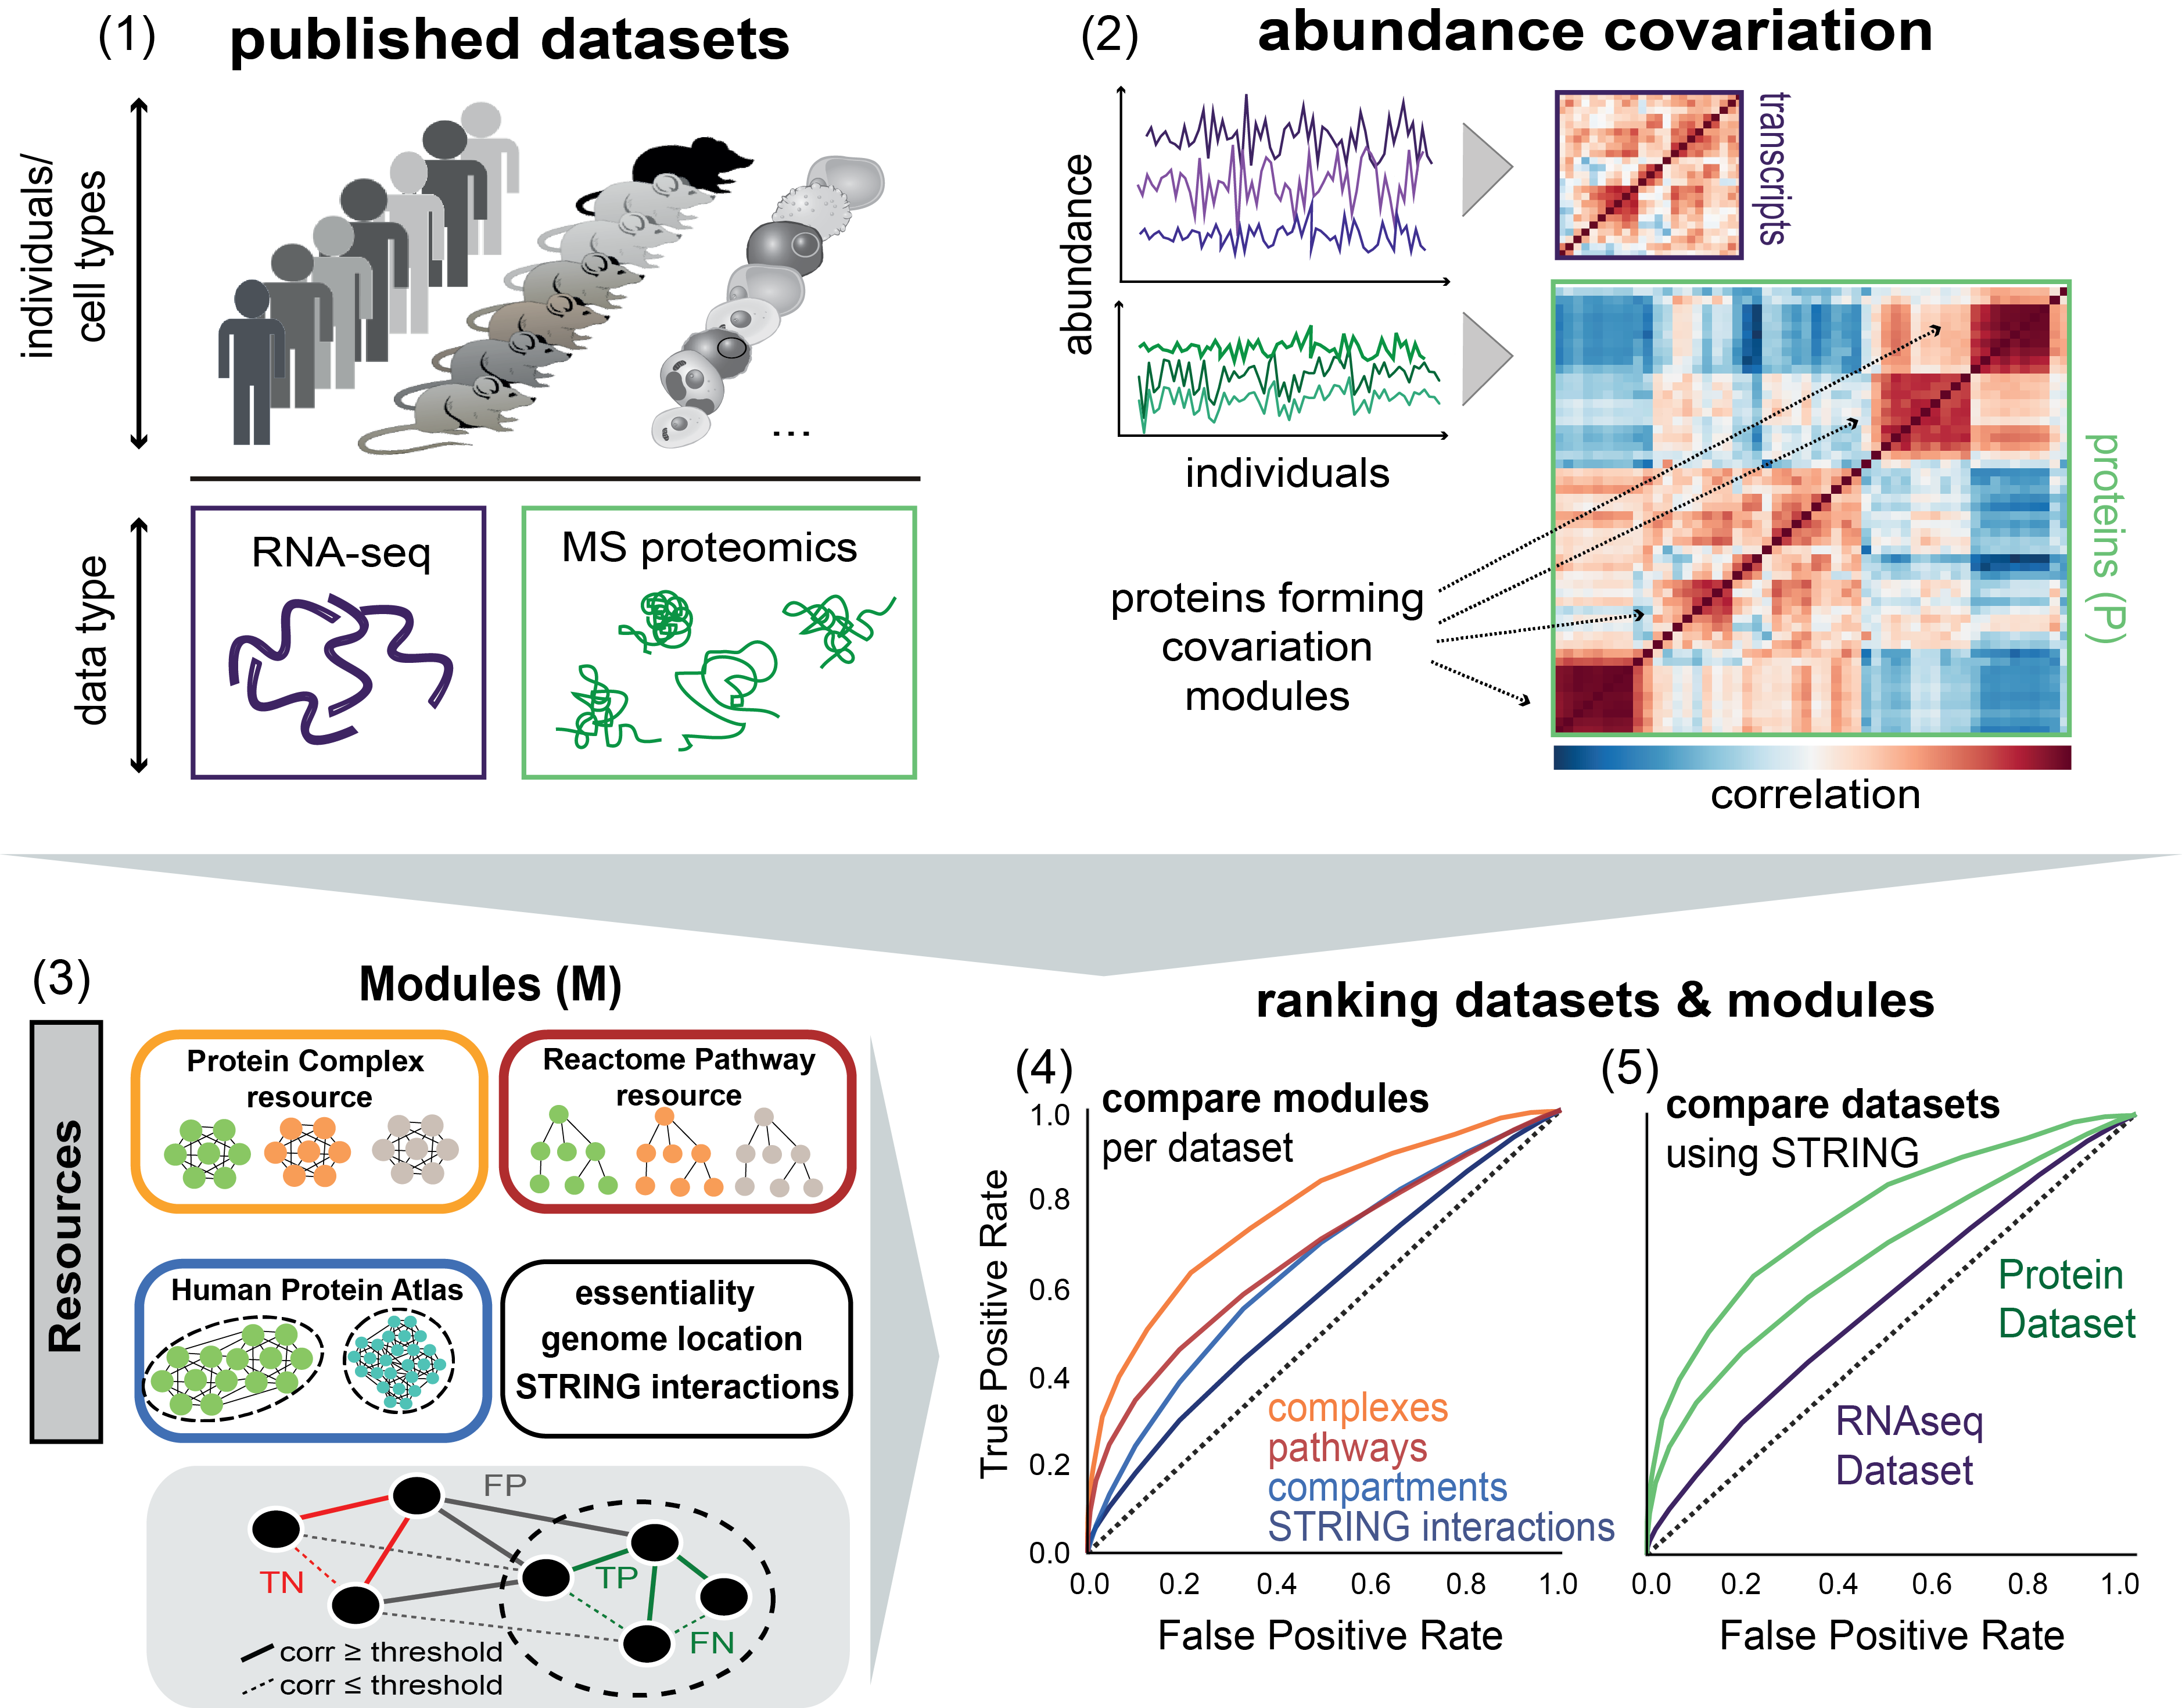
(1) Published proteomics datasets on human individuals, mouse strains and cell types are considered for the study (Table S1). If available, RNA-seq datasets for the respective specimens are also taken into account. (2) Co-variation of protein (or transcript) abundances is calculated for each dataset. (3) We integrate resources on protein modules (STRING protein interactions, protein complexes, Reactome pathways, Human Protein Atlas cellular localization, etc.) to reveal co-varying modules across individuals. The schematic below illustrates the definition of true positive (TP), false positive (FP), false negative (FN) and true negative (TN) interactions based on whether the interaction occurs within a module (dashed circle) or outside at a given correlation (corr) threshold. Iterating through correlation thresholds gives the receiver operating characteristics (ROC). (4) Different modules are then compared by the ROC metrics in each dataset (recovery of known modules). (5) Datasets can be compared by the degree of recoverable known co-variation (STRING interactions).
This figure has been generated with the following code: figure1_code
The underlying data can be found here.