Figure 2
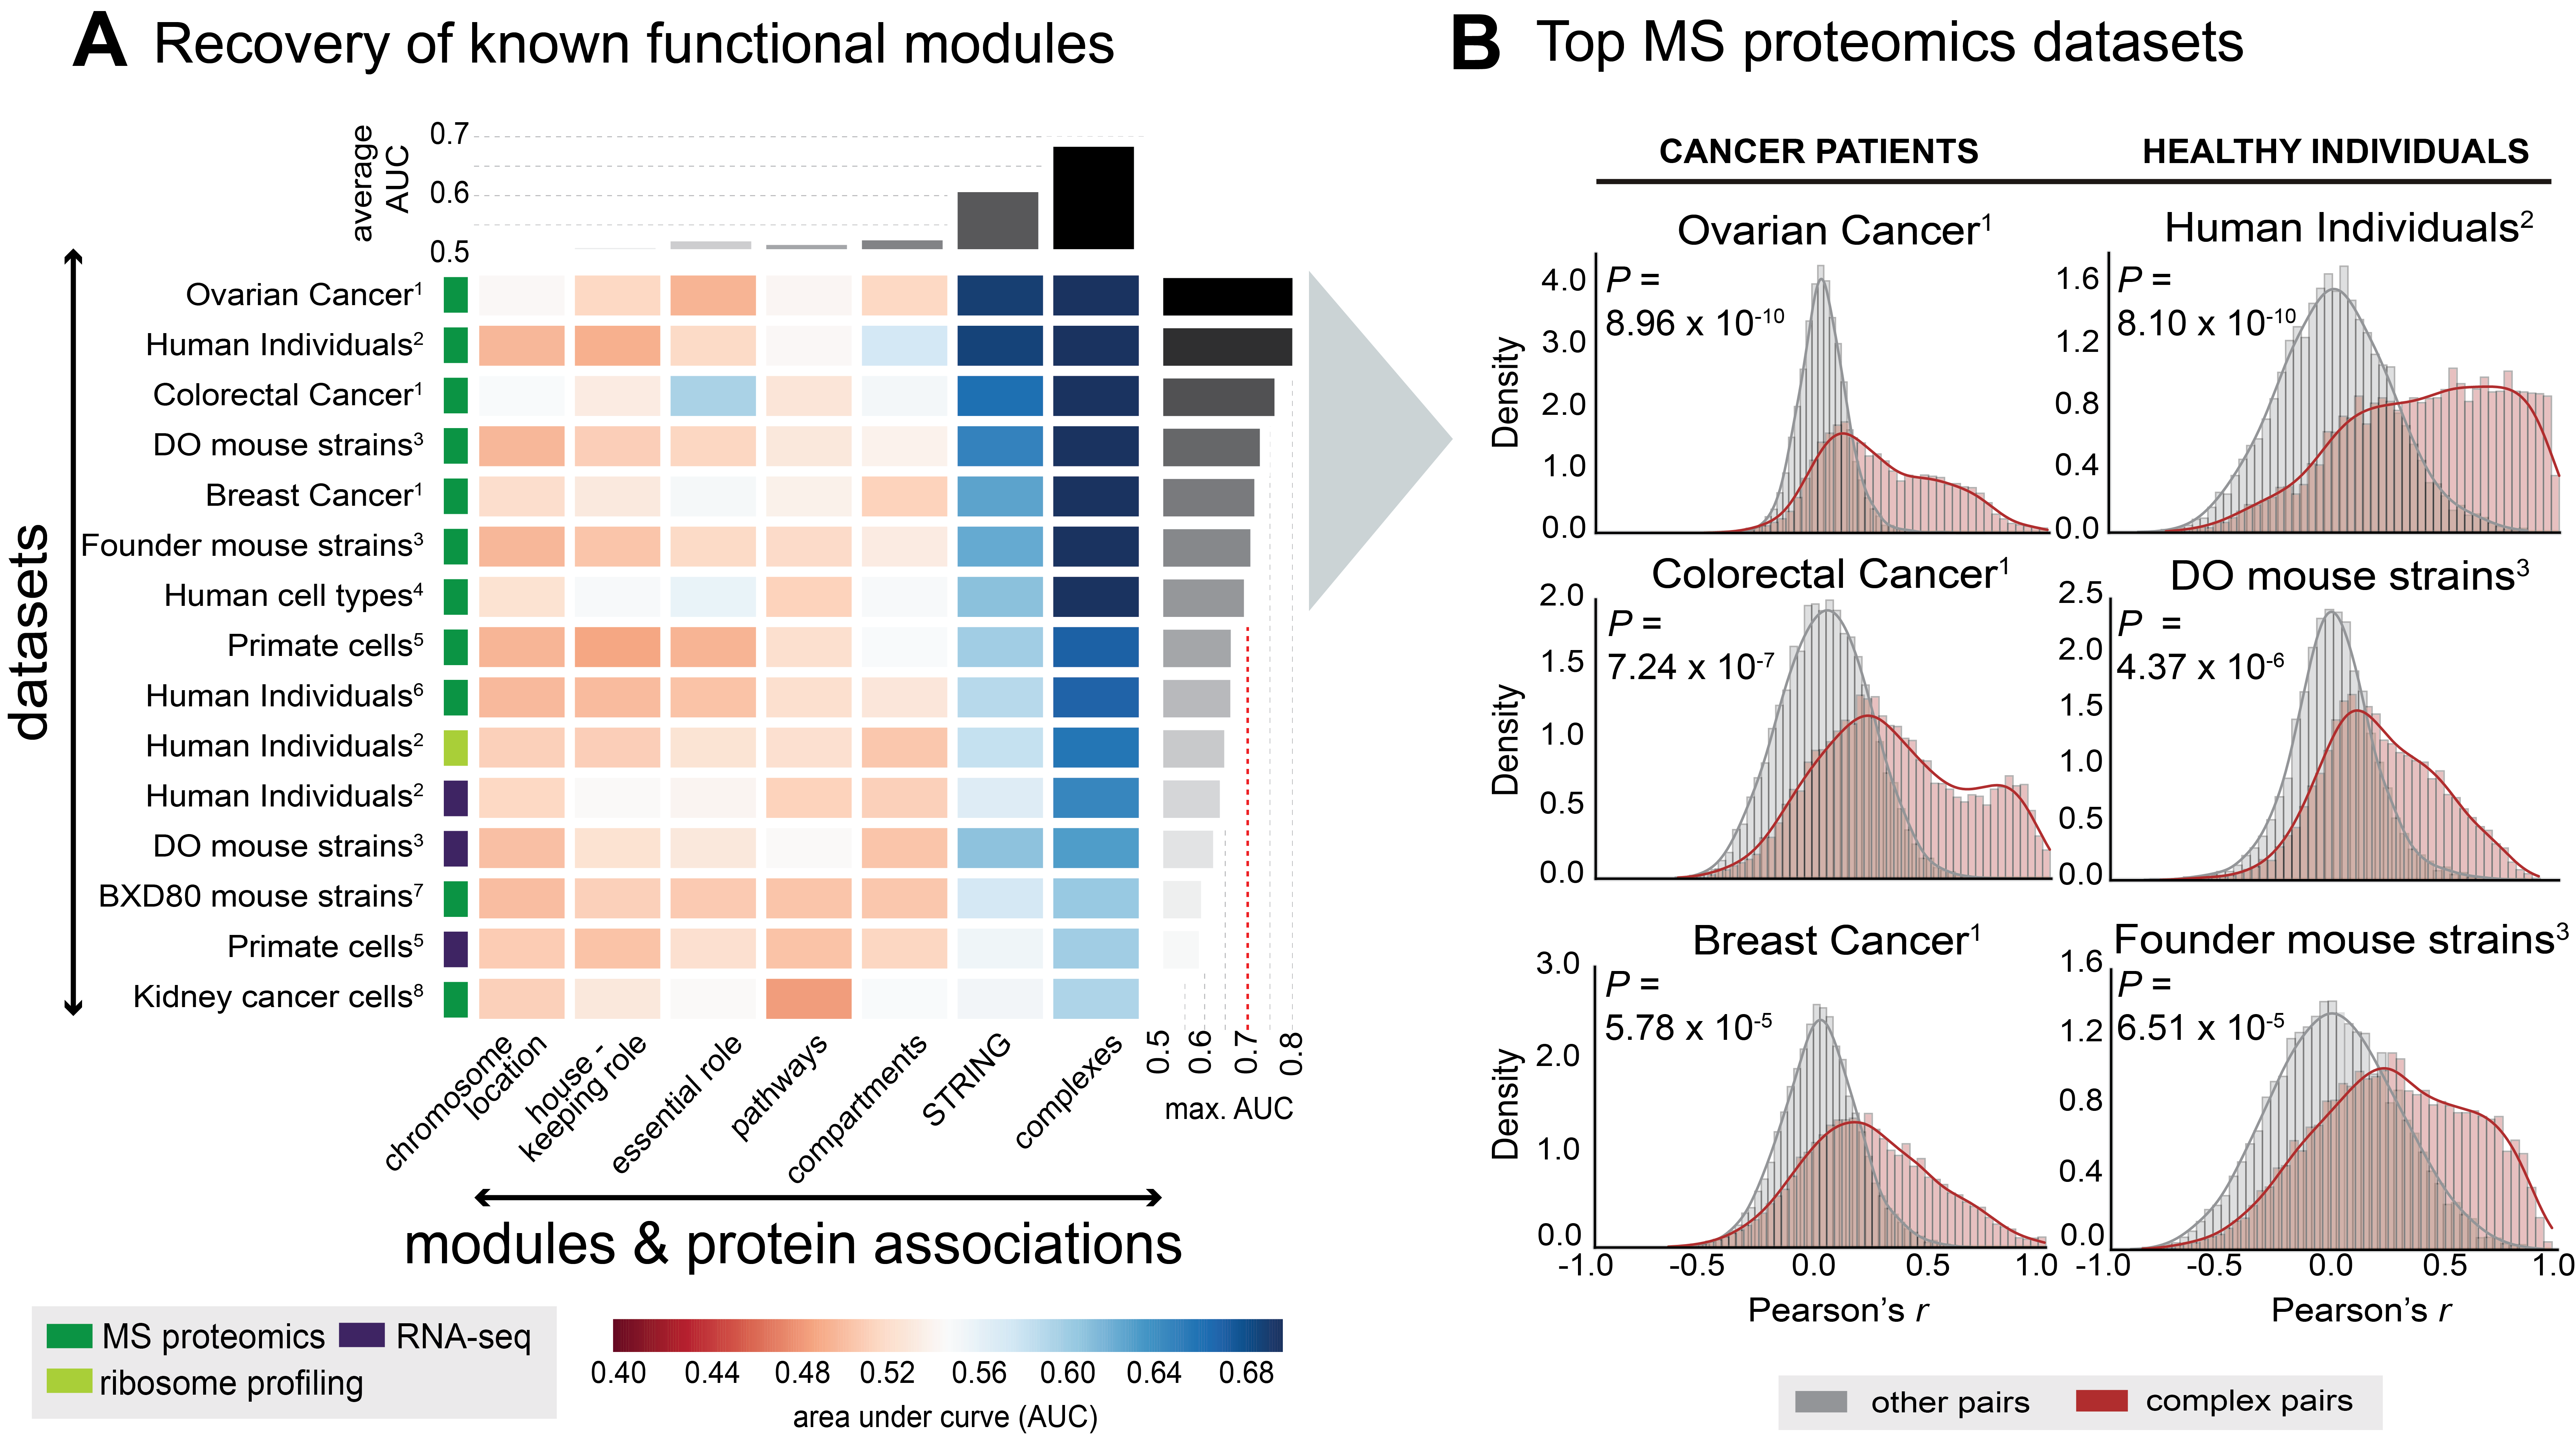
(A) Recovery of known functional modules by means of receiver operating characteristic (ROC)-analysis. Each cell of the matrix displays the AUC (area under curve) value for a given module (x-axis) in the given dataset (y-axis). Modules or protein associations are ordered according to respective average AUC. The type of data is indicated by the colored boxes next to the dataset. The number indicates the reference for the respective dataset, with (1) referring to the The Cancer Genome Atlas (TCGA) publications, (2) Battle et al., 2015, (3) Chick et al., 2016, (4) Geiger et al., 2012, (5) Khan et al., 2013, (6) Wu et al., 2013, (7) Williams et al., 2016, and (8) Guo et al., 2015. More details on the datasets are given in Table S1.
(B) The shift in Pearson correlation values (x-axis) for complex-associated proteins (dark-red) relative to the background correlation values (grey) is illustrated for the top 6 datasets derived from (A) as density graphs (AUC > 0.7). The p-value (indicated as P) indicates how significant the correlation shift is (one-tailed Mann-Whitney U-test).
This figure has been generated with the following code: figure2_code
The underlying data can be found here.