Supplementary Figure 4
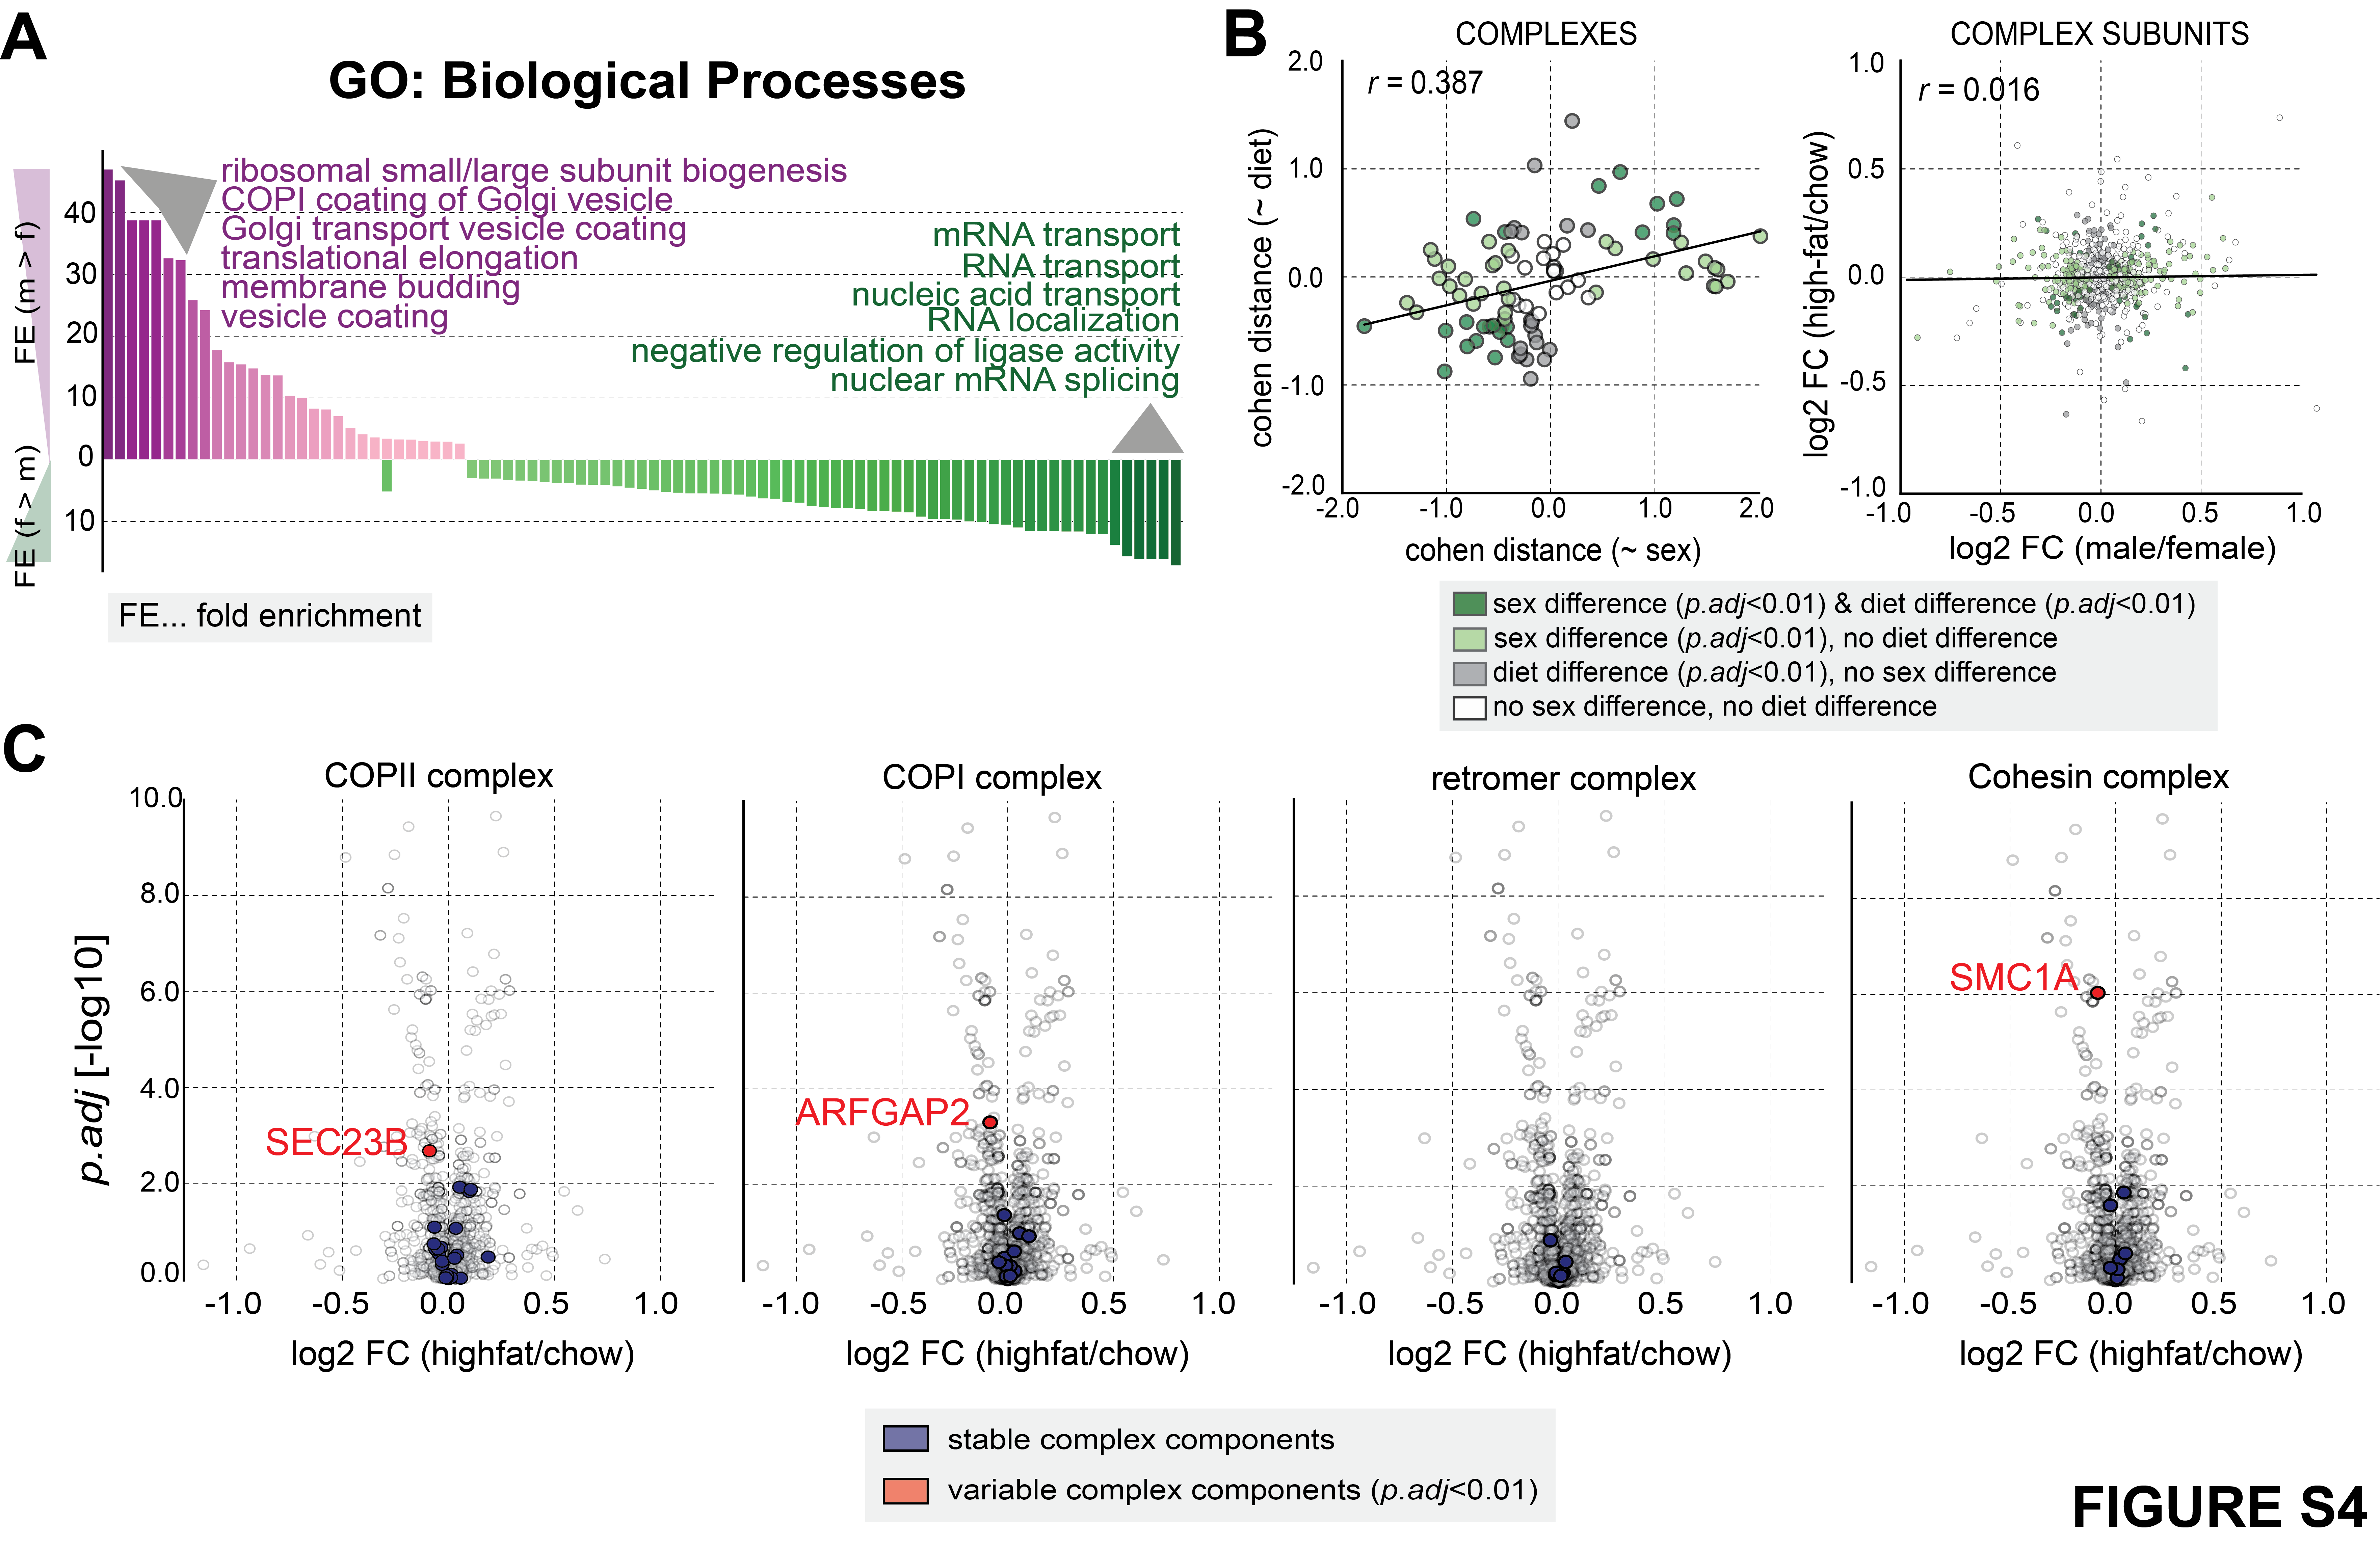
(A) GO-enrichment analysis (biological processes, see methods) for complexes that are either more abundant in male (purple) or female (green) mice (FDR < 1%, Fisher’s exact test). The x-axis shows the individual GO-biological processes that were found to be enriched in male or female mice; the y-axis shows the fold-enrichment (FE) for each of the processes (upper part: higher enrichment in male vs. female; lower part: higher enrichment in female vs. male).
(B) (left) Scatter plot displaying the Cohen distances for sex- (x-axis) and diet-differences (y-axis) in complex median abundance. (right) Stoichiometry changes (LIMMA-derived log2 fold-changes) for male/female differences (x-axis) and high-fat/chow differences (y-axis) are compared for all complex members.
(C) Sex-specific stoichiometry of complexes is not influenced by diet differences. Volcano plots illustrate diet differences in stoichiometry instead of differences due to genetic sex (as shown in Figure 5B).
This figure has been generated with the following code: suppFigure4_code
The underlying data can be found here.