Figure 5
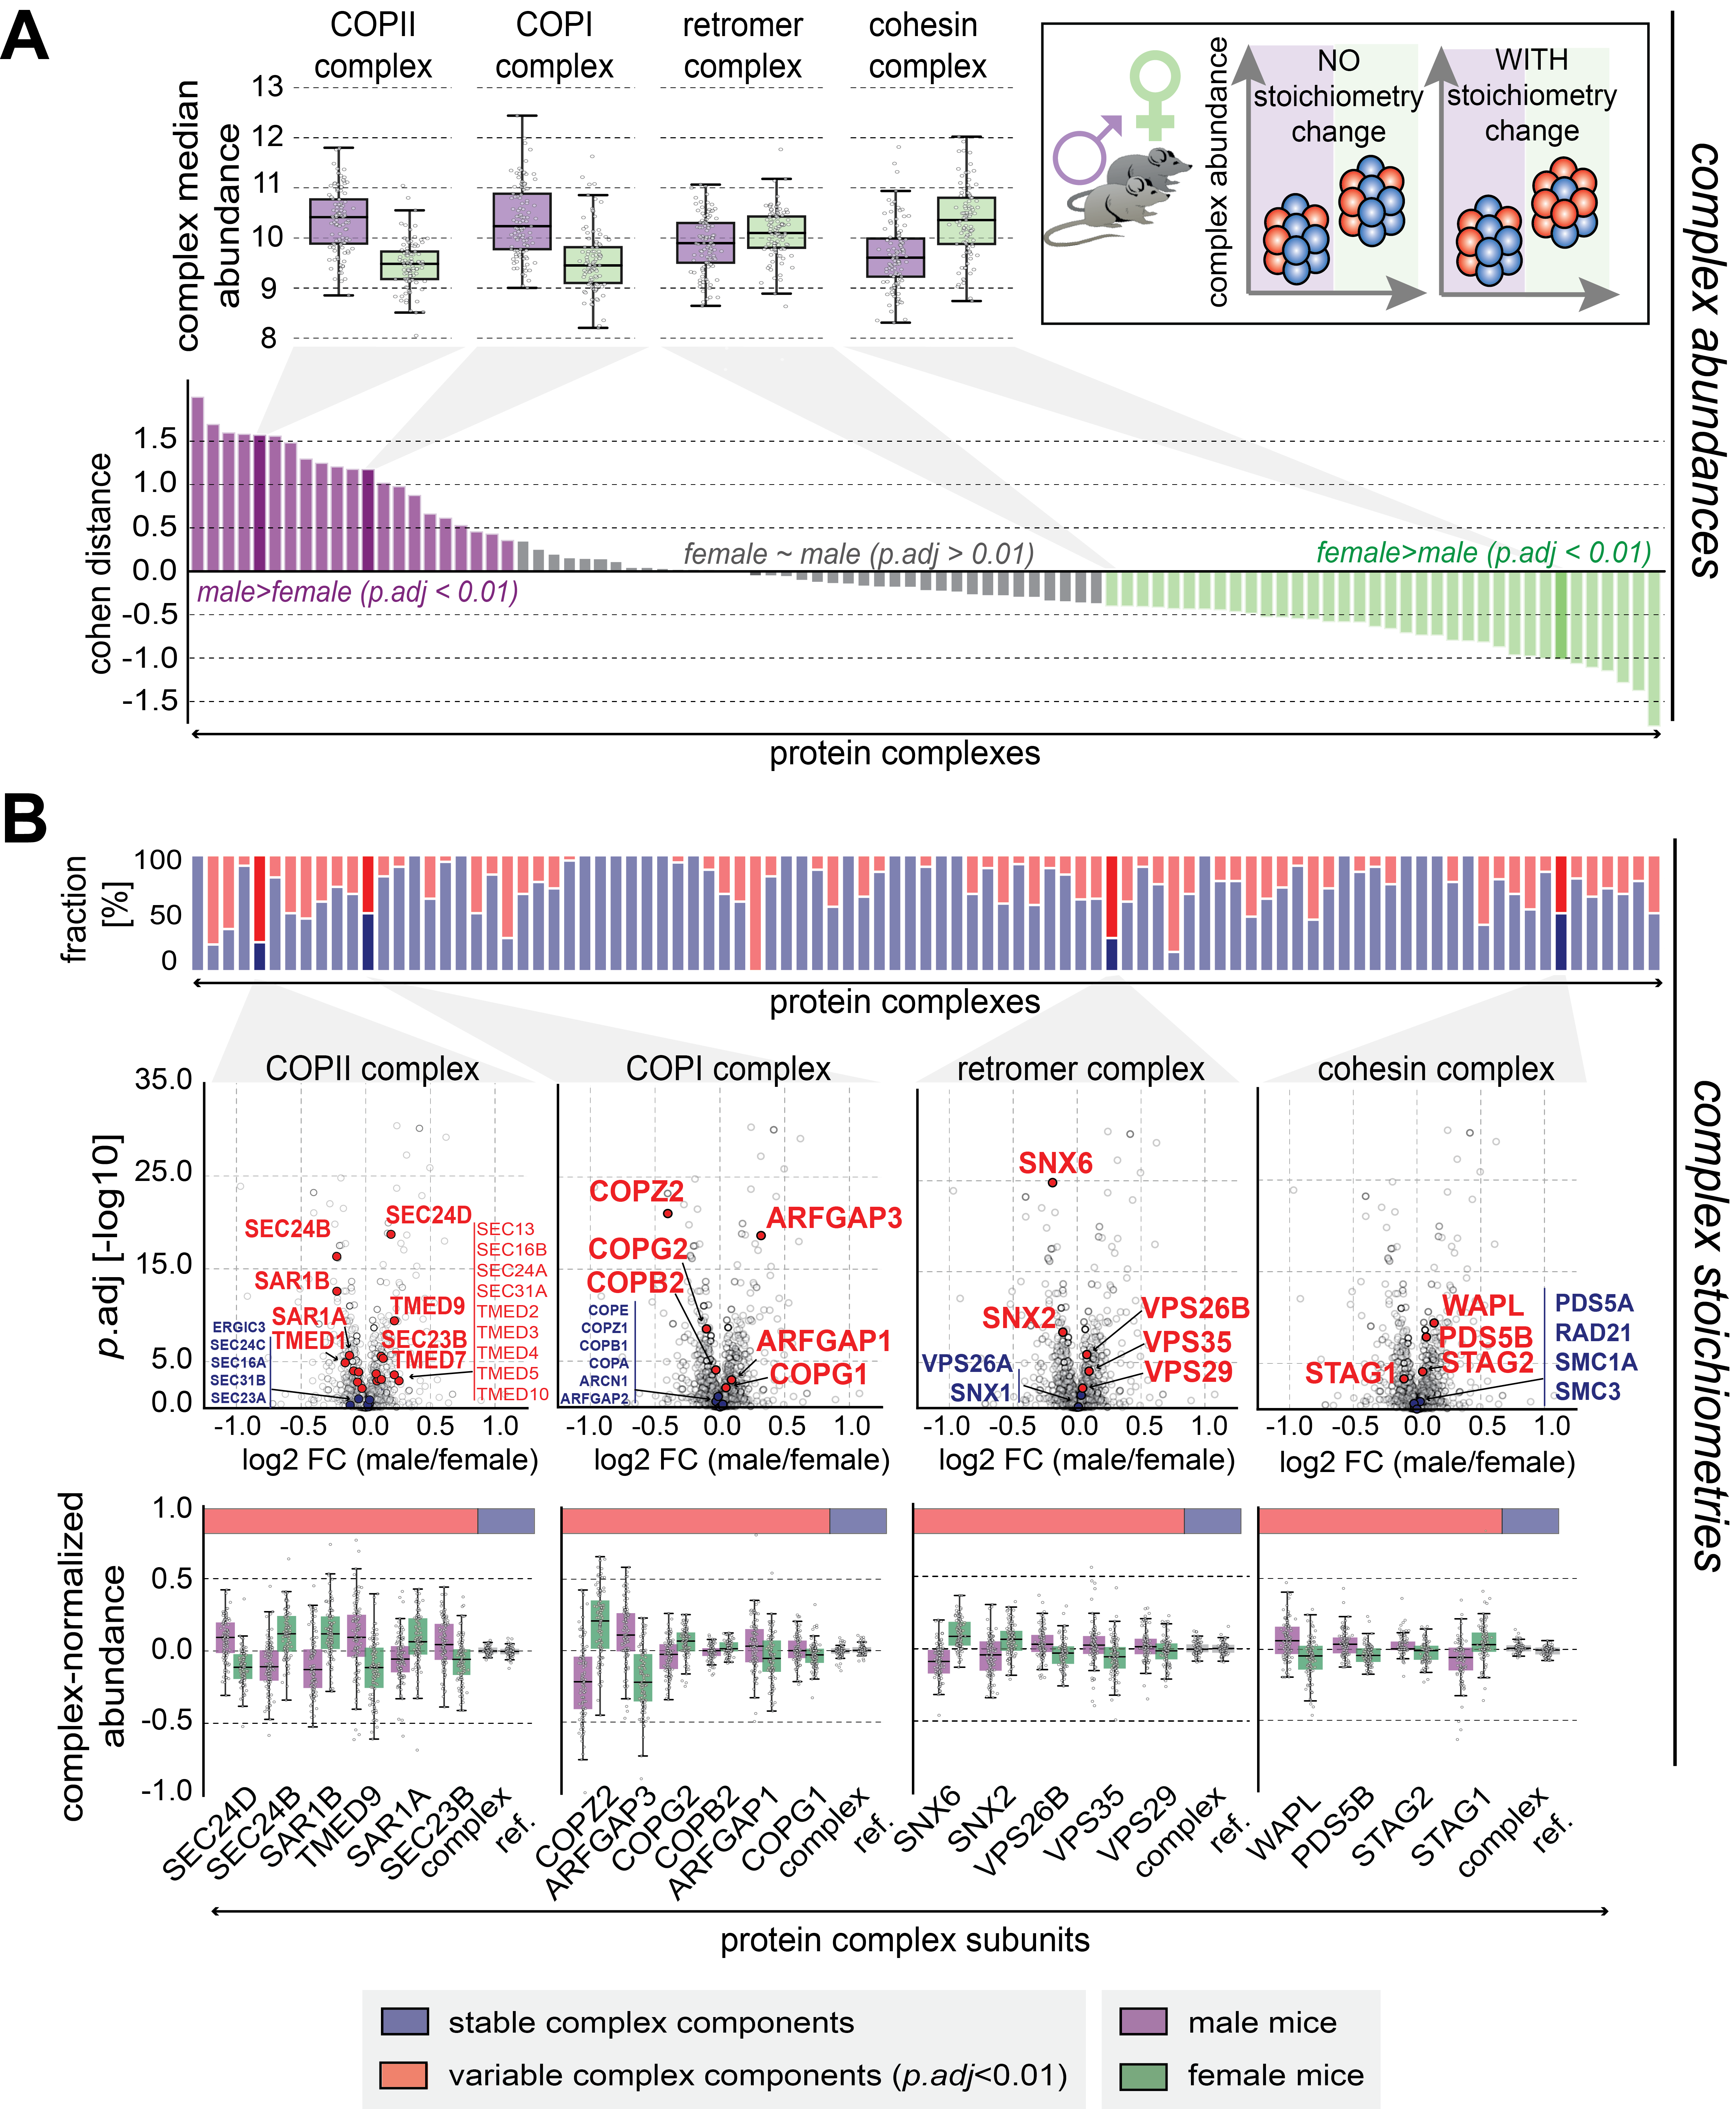
(A) Delineation of differential abundance of protein complexes between male (purple) and female (green) DO mice. The effect sizes (Cohen Distance) is shown across all 96 complexes with colors corresponding to significant effects (FDR-corrected p-value < 0.01 (denoted as p.adj), two-tailored t-test). Complex median abundances for selected examples are highlighted in the boxplots above the Cohen-Distance barplots. The inset panel (upper right) illustrates the concepts of abundance variation and stoichiometry of protein modules.
(B) For each complex, the fraction of stable components (blue, not changing in stoichiometry between male and female mice) and differential stoichiometric hits (red) are shown. The volcano plots beneath illustrate the underlying data with log2-fold changes (denoted as FC, male/female, x-axis) and the adjusted p-value on the y-axis. Complex-normalized abundances are shown below, highlighting male and female stoichiometry within complexes for variable complex members (red). The stable components (blue) are summarized as complex ref.
This figure has been generated with the following code: figure5_code
The underlying data can be found here.
