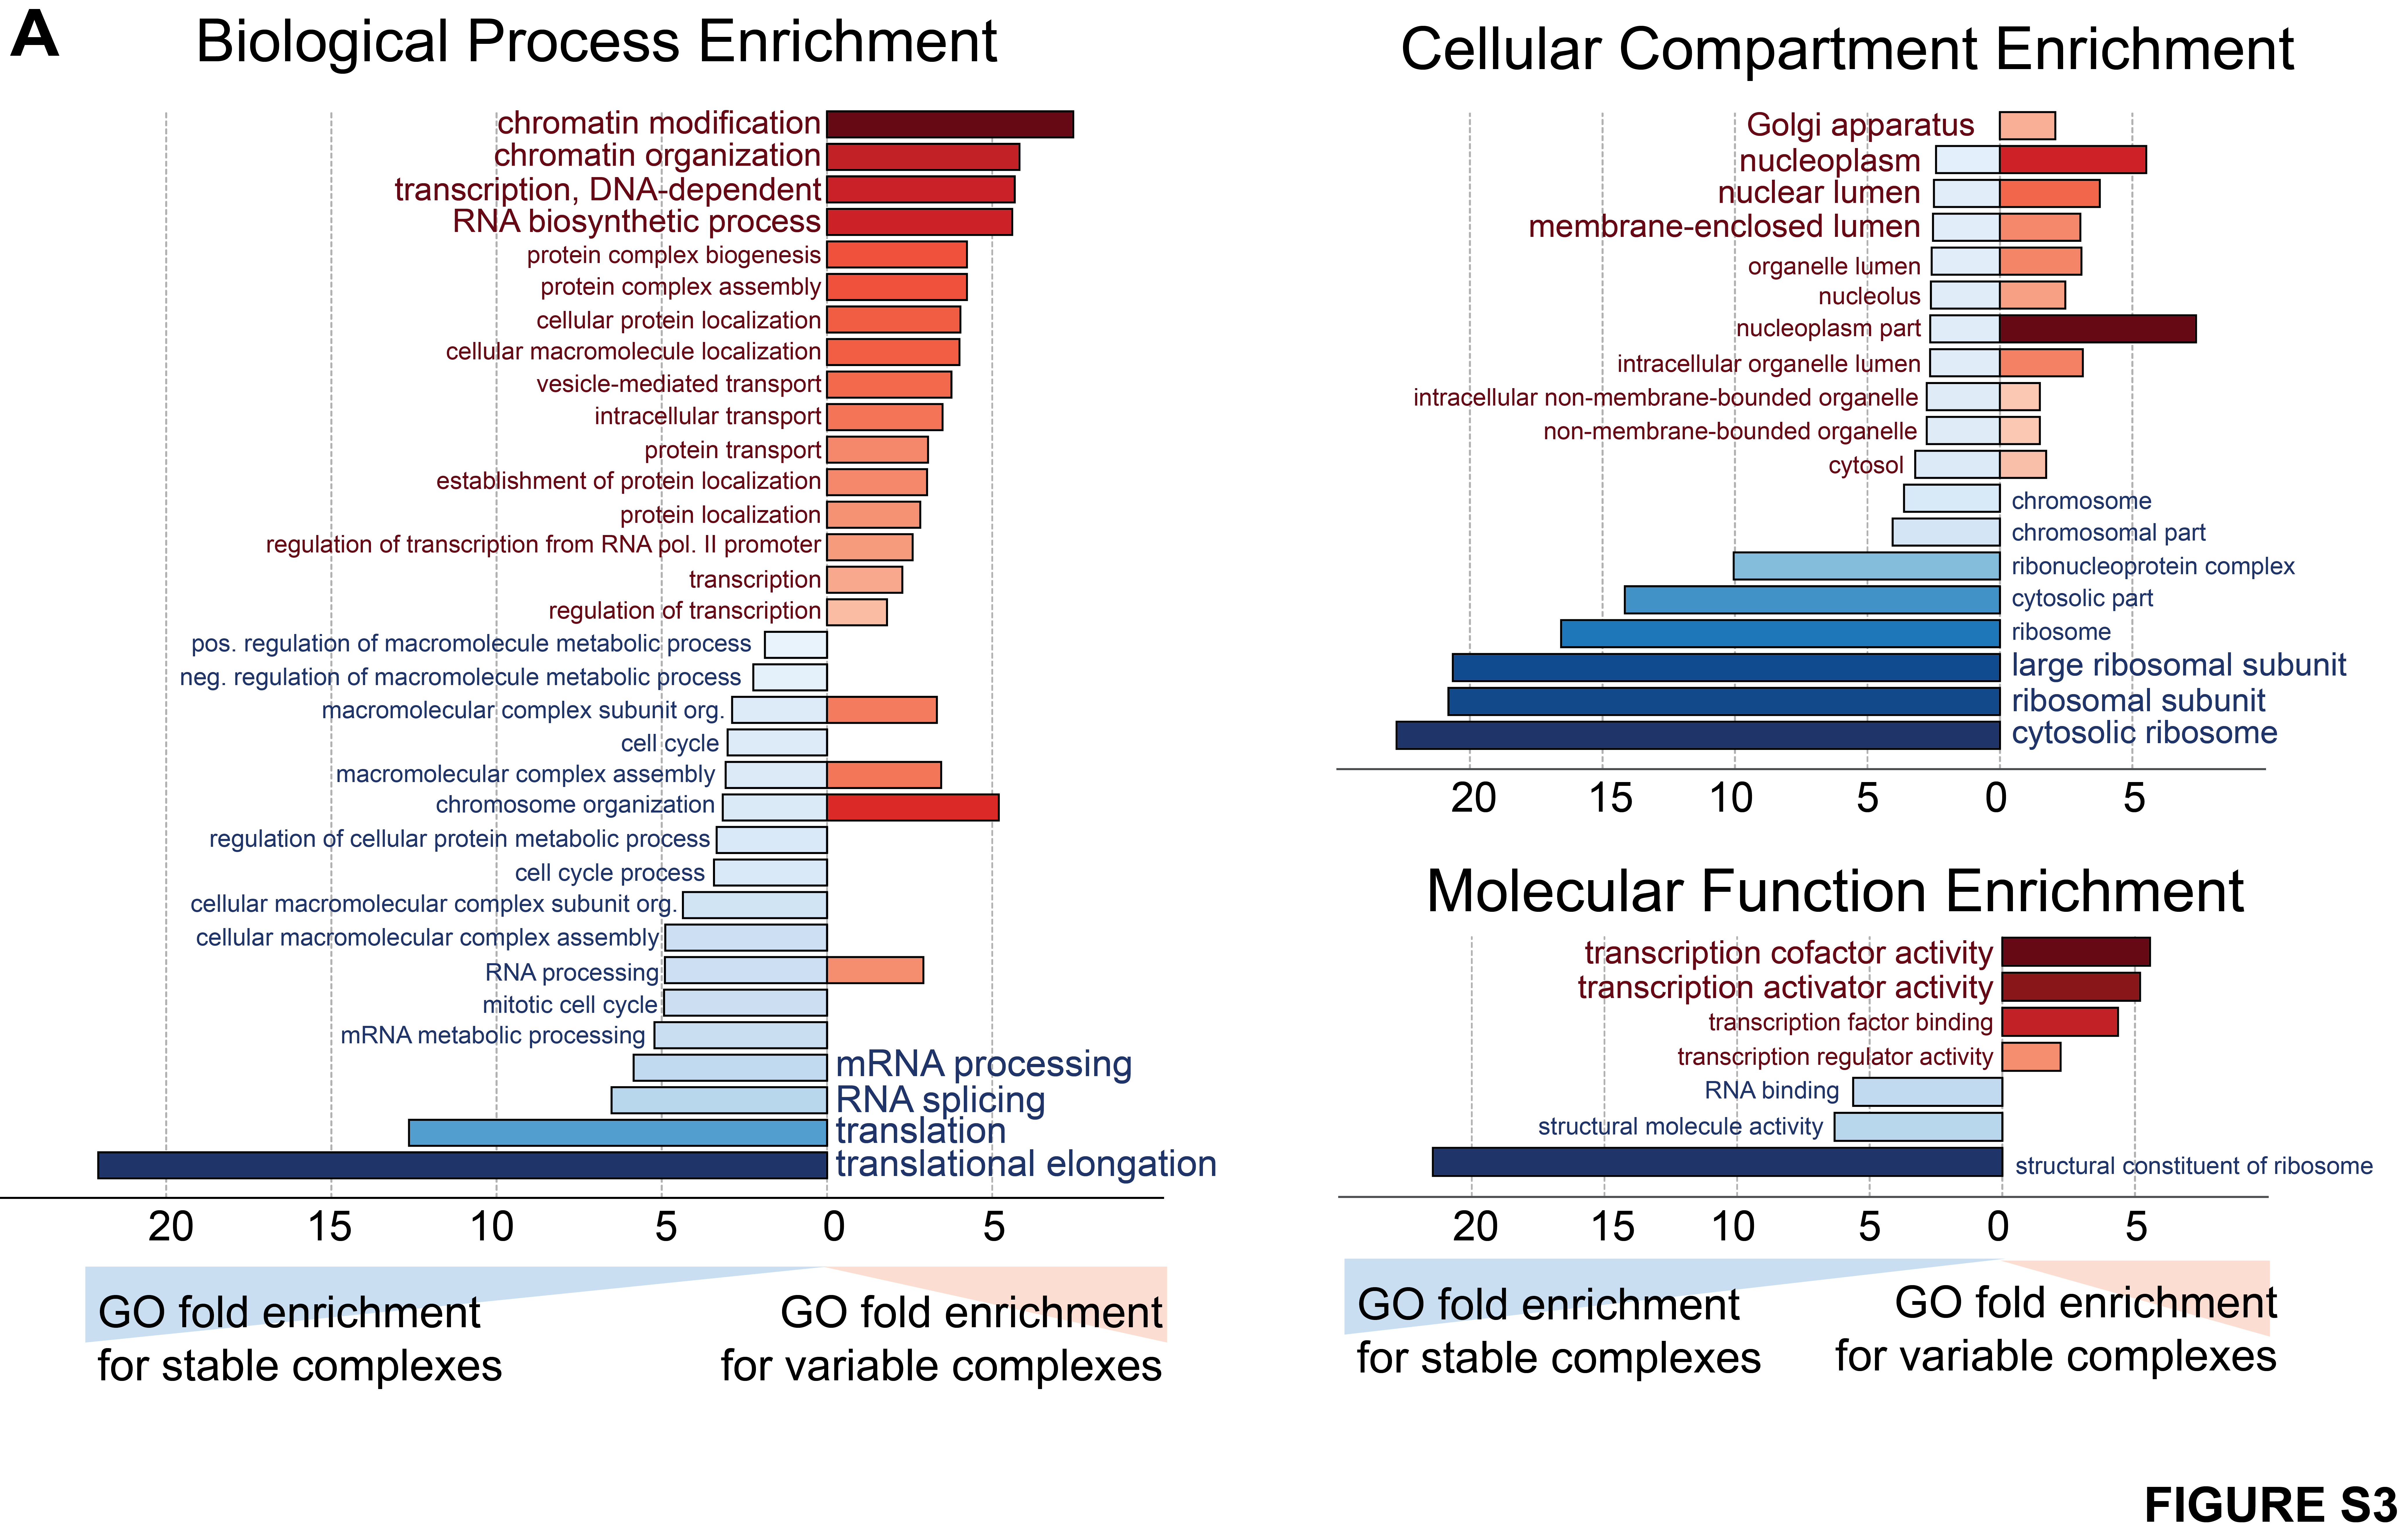
Supplementary Figure 3
(A) GO-enrichment analysis in 3 categories (Biological Processes, Cellular Compartment and Molecular Function) delineating the functional differences between stable and variable complexes as recovered from Figure 3. The x-axis represents fold-enrichment for stable complexes to the left (blue), whereas to the right fold-enrichments are shown for variable complexes (red). Color opacity correlates with the fold-changes. Only GO-terms with an FDR < 1% (Benjamini-Hochberg) are shown.
This figure has been generated with the following code: suppFigure3_code
The underlying data can be found here.
