Supplementary Figure 5
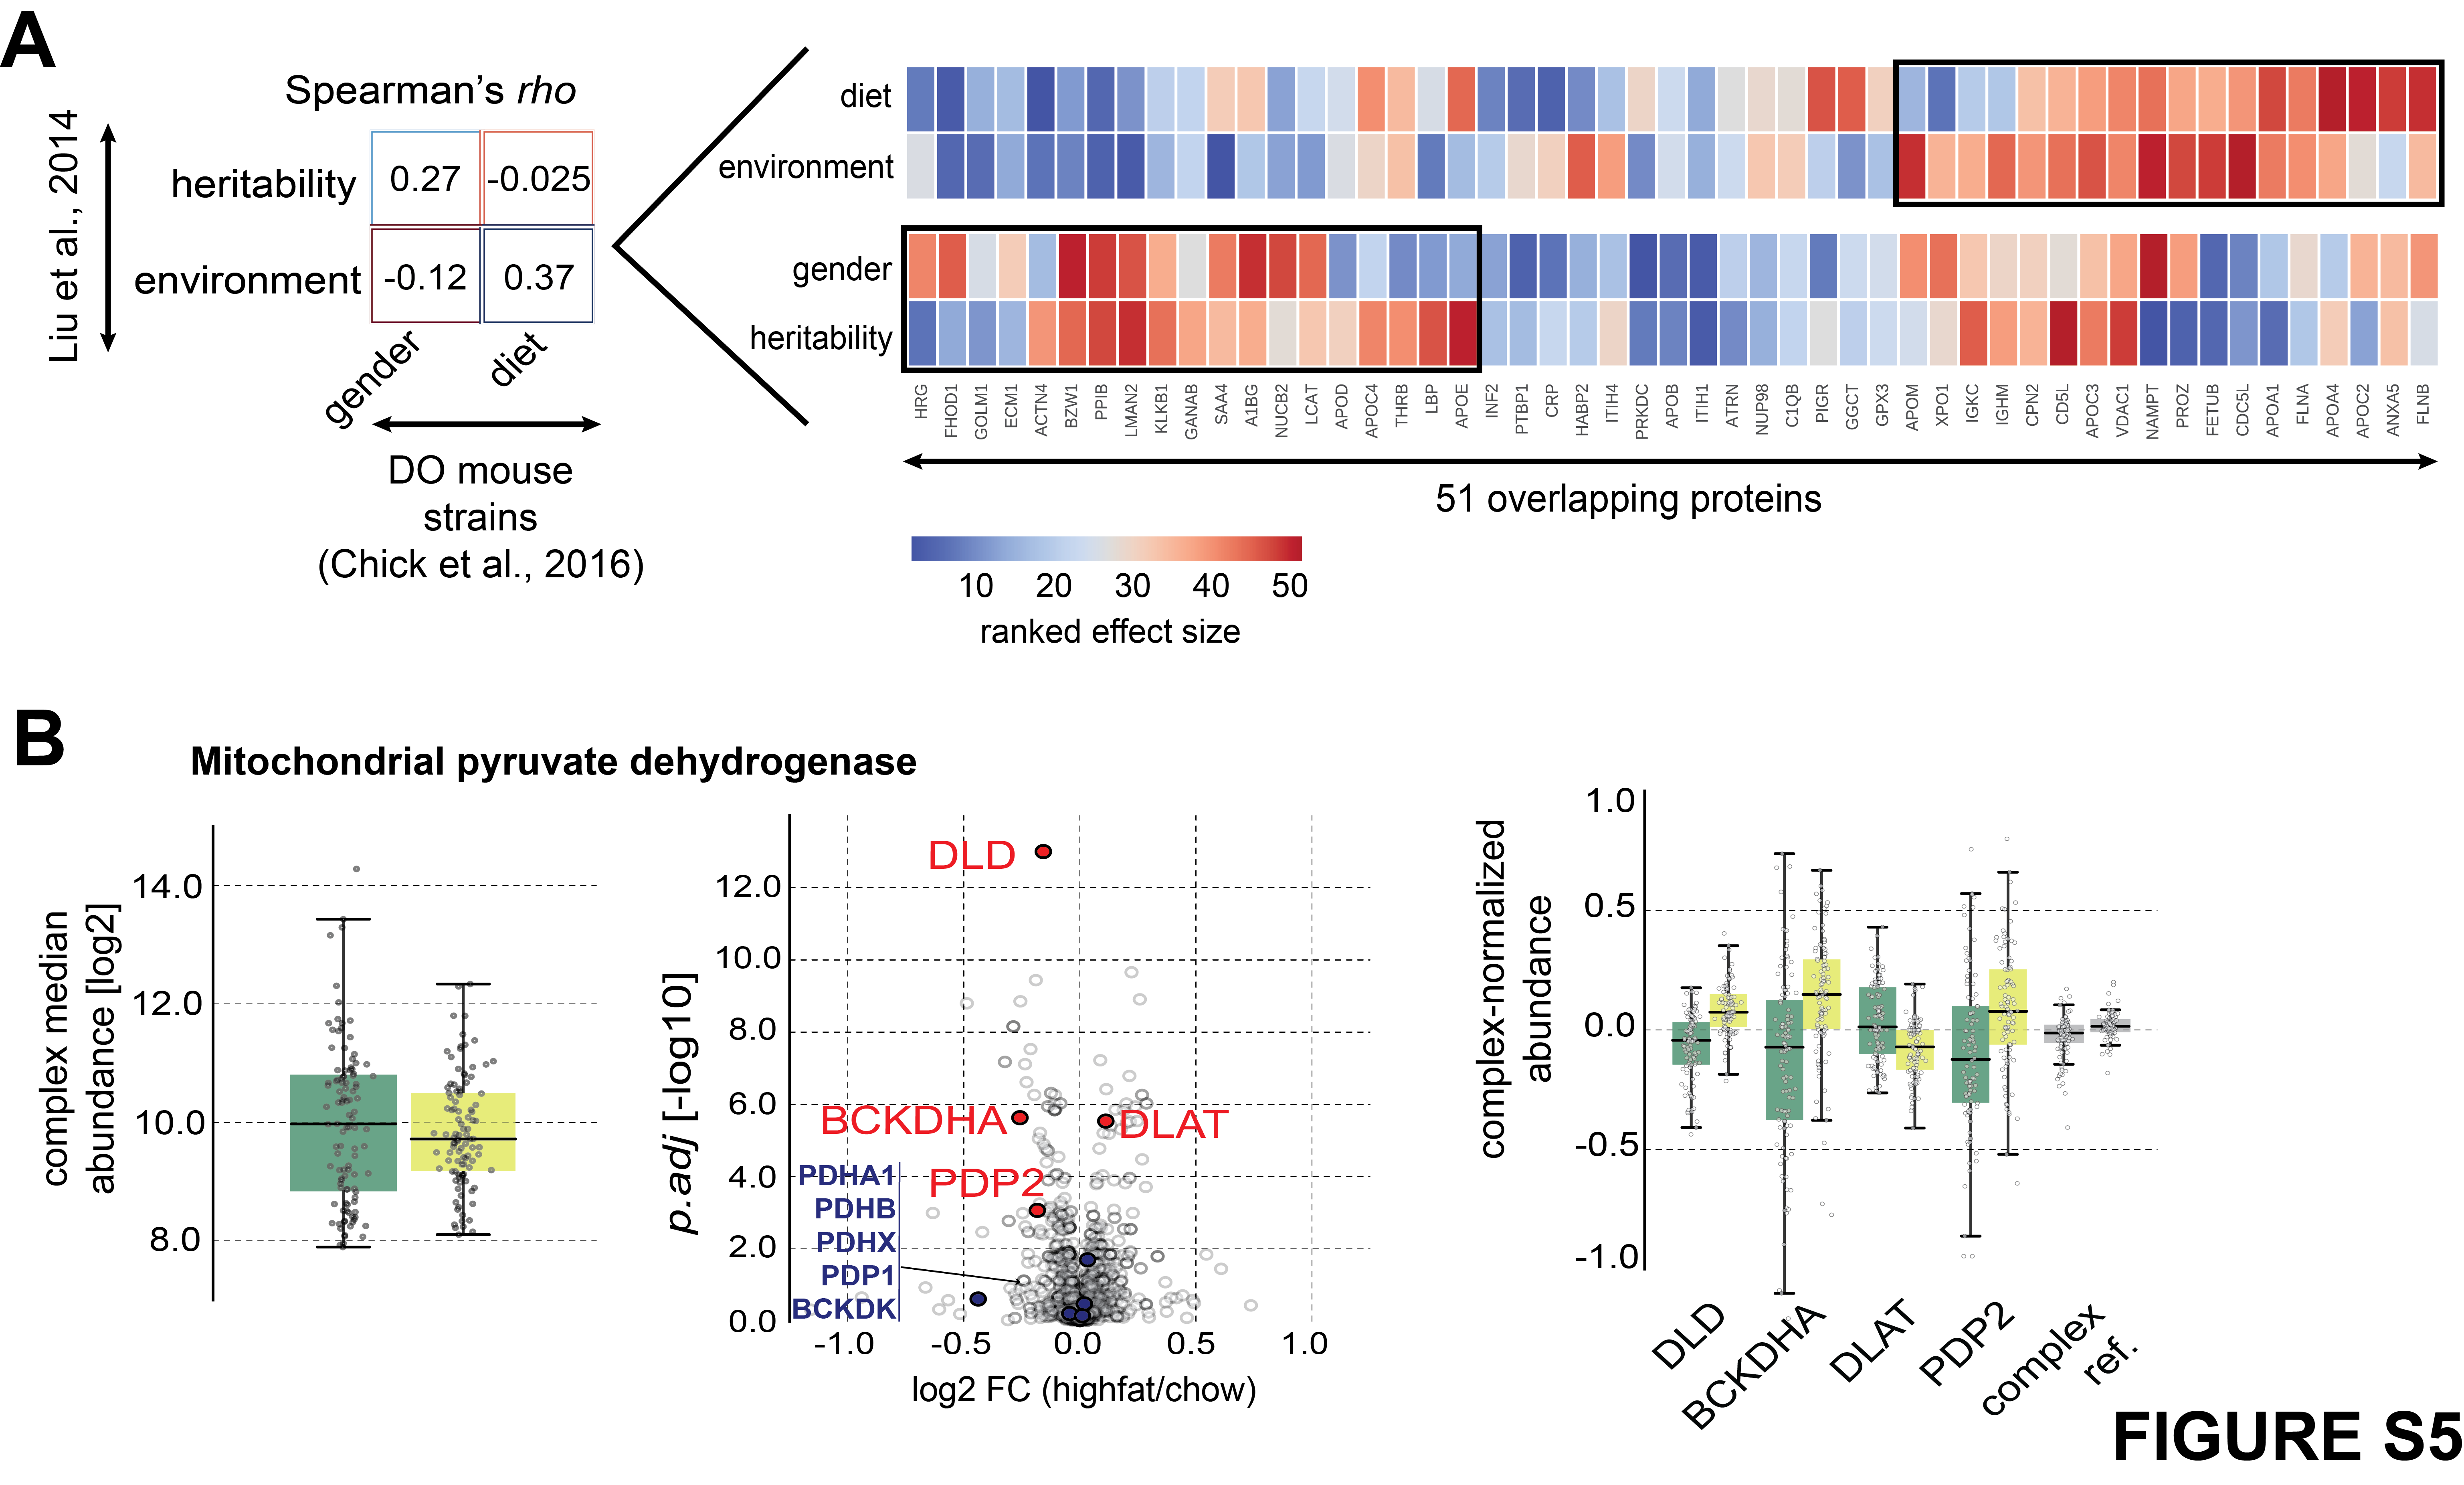
(A) (left) Summary of Spearman’s correlation values between effect sizes on proteins derived from Liu et al., 2014, and effect sizes calculated for proteome of DO mouse strains. (right) The heatmap displays the ranked effect sizes for 51 proteins that were quantified in both Liu et al., 2014, and DO mouse strains (red: stronger effect; blue: lower effect). The factors affecting proteins are listed on the left side of the heatmap.
(B) Diet-specific stoichiometry of the mitochondrial pyruvate dehydrogenase: (left) the overall complex median abundance is not affected, (center) volcano plot highlighting the complex-specific fold-changes of particular subunits of the complex, (right) complex-normalized abundances with enhanced differentially expressed proteins (high-fat = dark green, chow = light green).
This figure has been generated with the following code: suppFigure5_code
The underlying data can be found here.