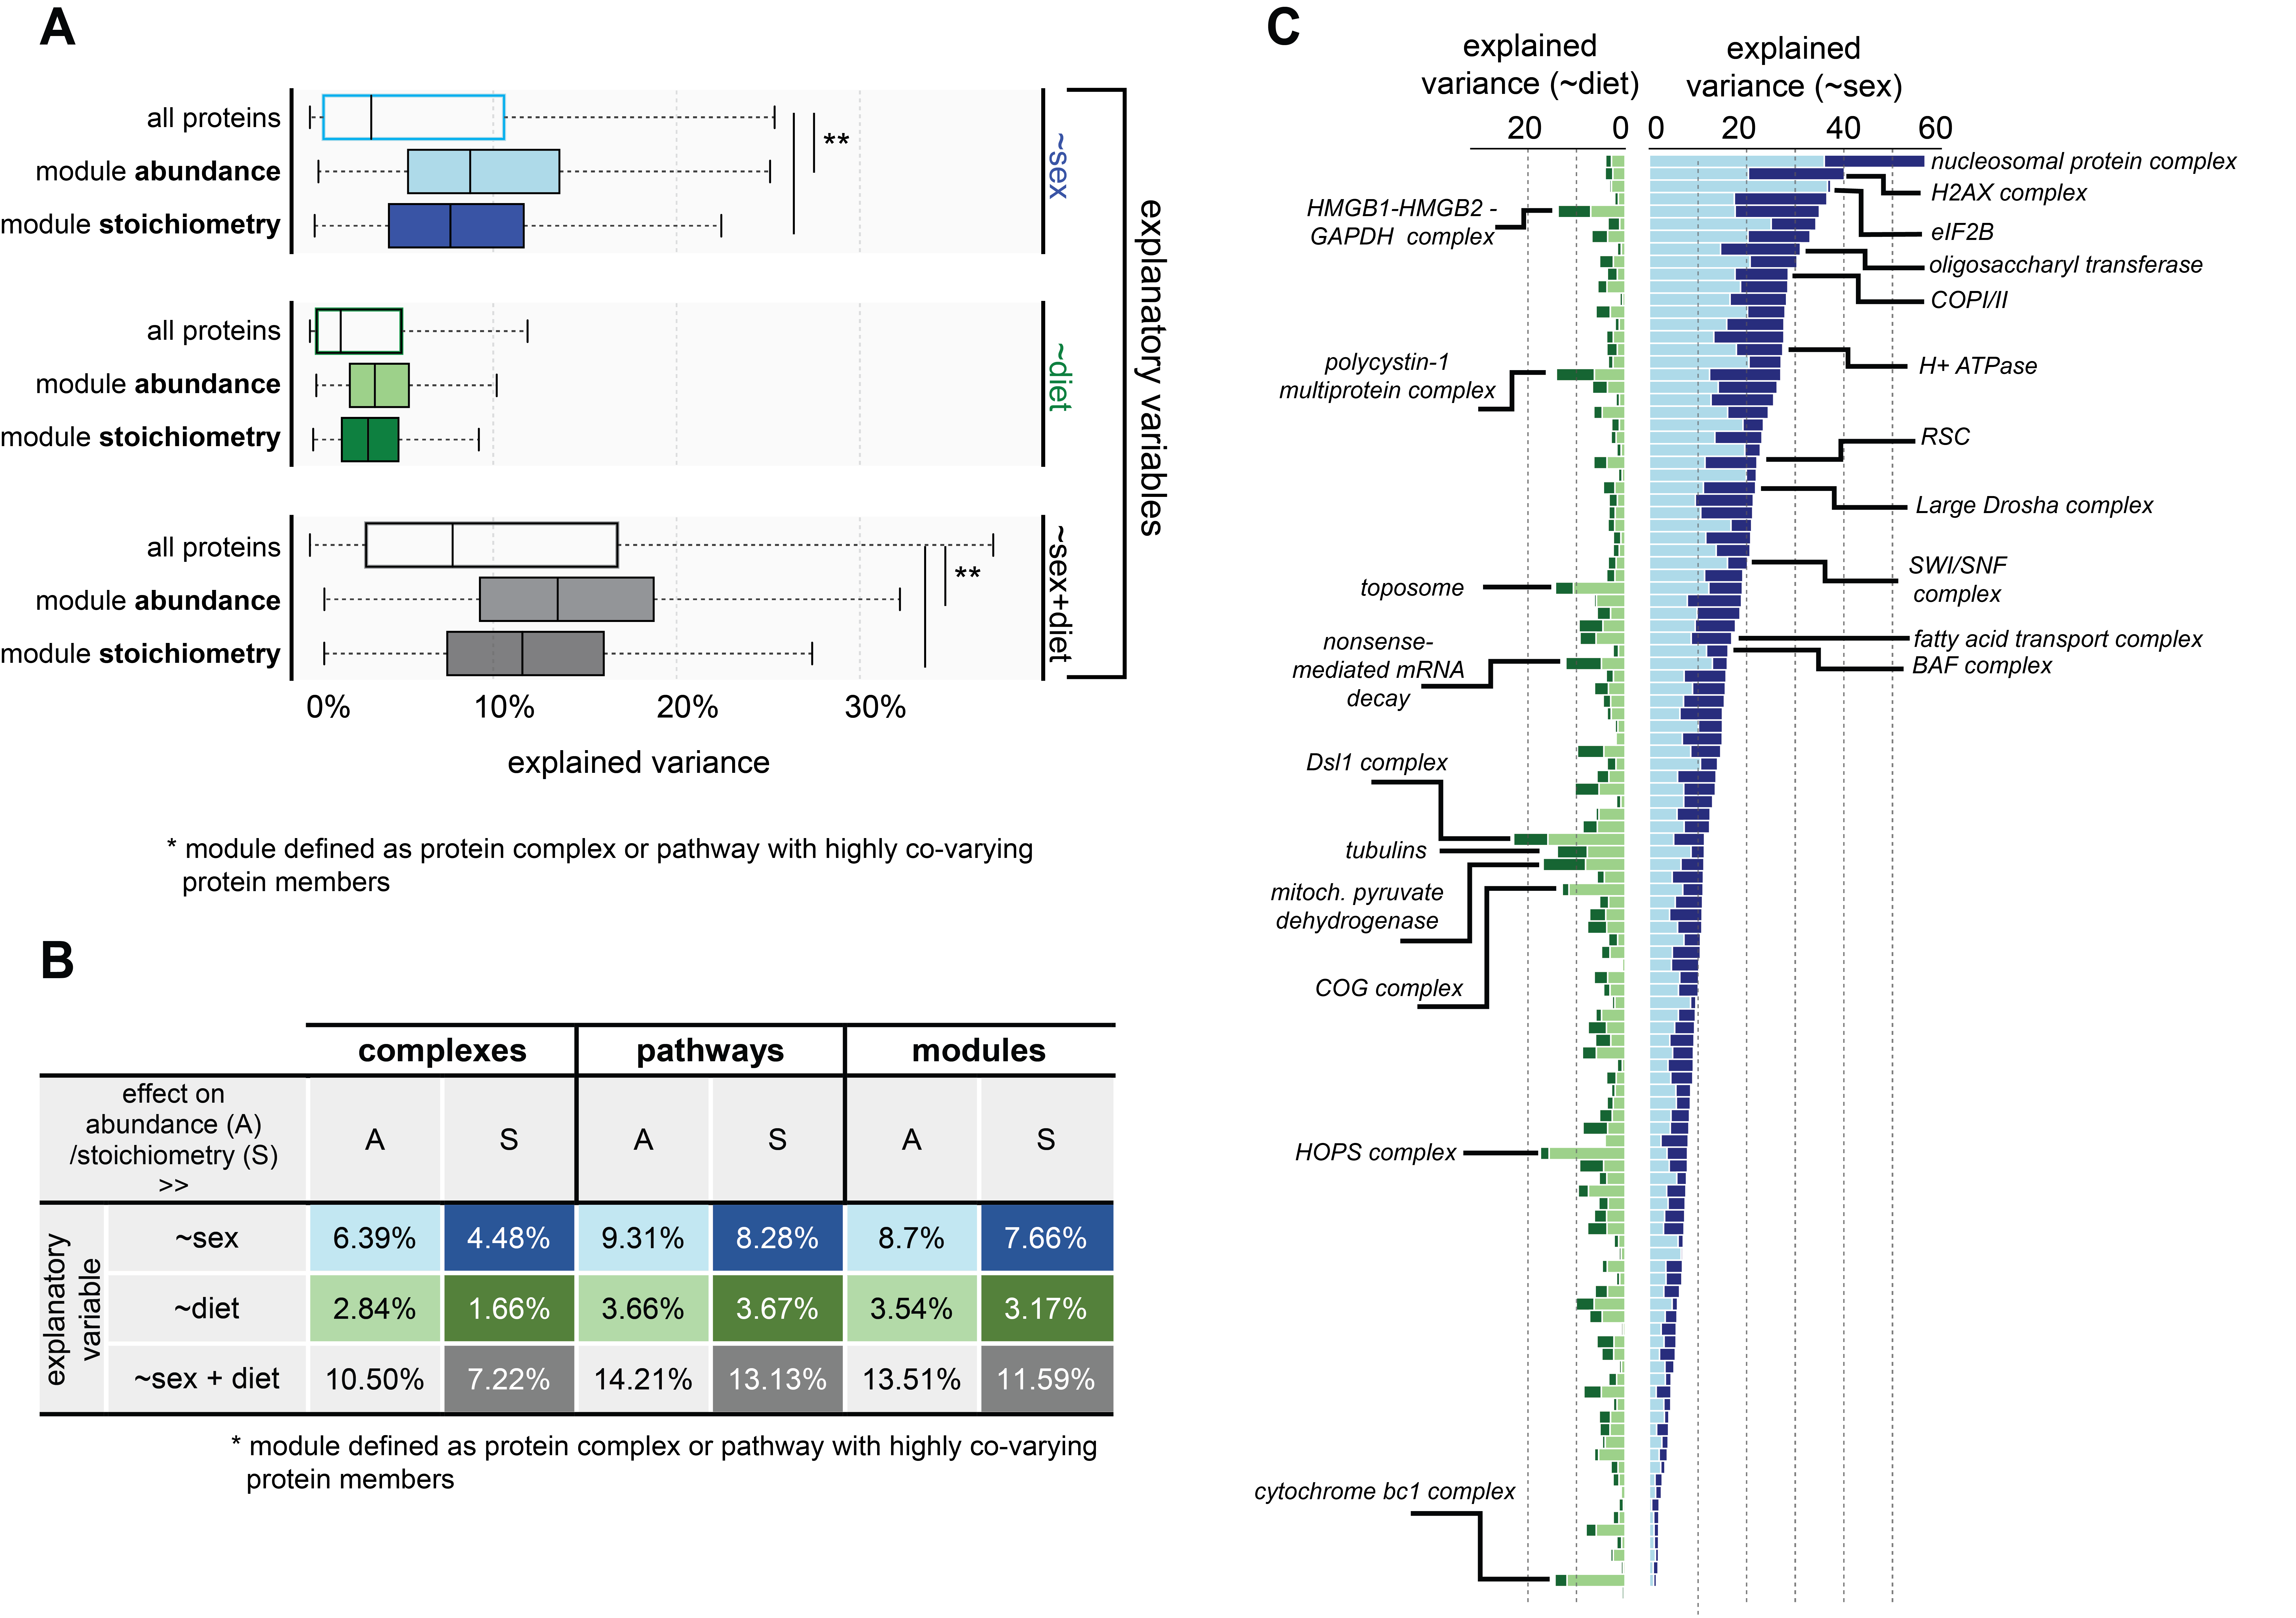
Figure 6
(A) Distribution of the overall effect of sex, diet and the cumulative effect (sex + diet) on protein abundance variation (all proteins), as well as abundance and stoichiometry variation of modules, including protein complexes and pathways with highly co-varying protein members (see Methods). The lighter colors correspond to effects on abundances, whereas darker colors correspond to effects on module stoichiometry.
(B) Table displaying median effect sizes of respective variables on complexes only, pathways only and modules, comprising both complexes and pathways.
(C) Distribution of sex- and diet-dependent effect sizes on all complexes (with ≥5 protein members), with lighter colors illustrating effects on abundances and darker colors effects on stoichiometry (see legend from A). Selected complexes showing high degree of variability explained by either sex or diet are highlighted.
This figure has been generated with the following code: figure6_code
The underlying data can be found here.
