Supplementary Figure 6
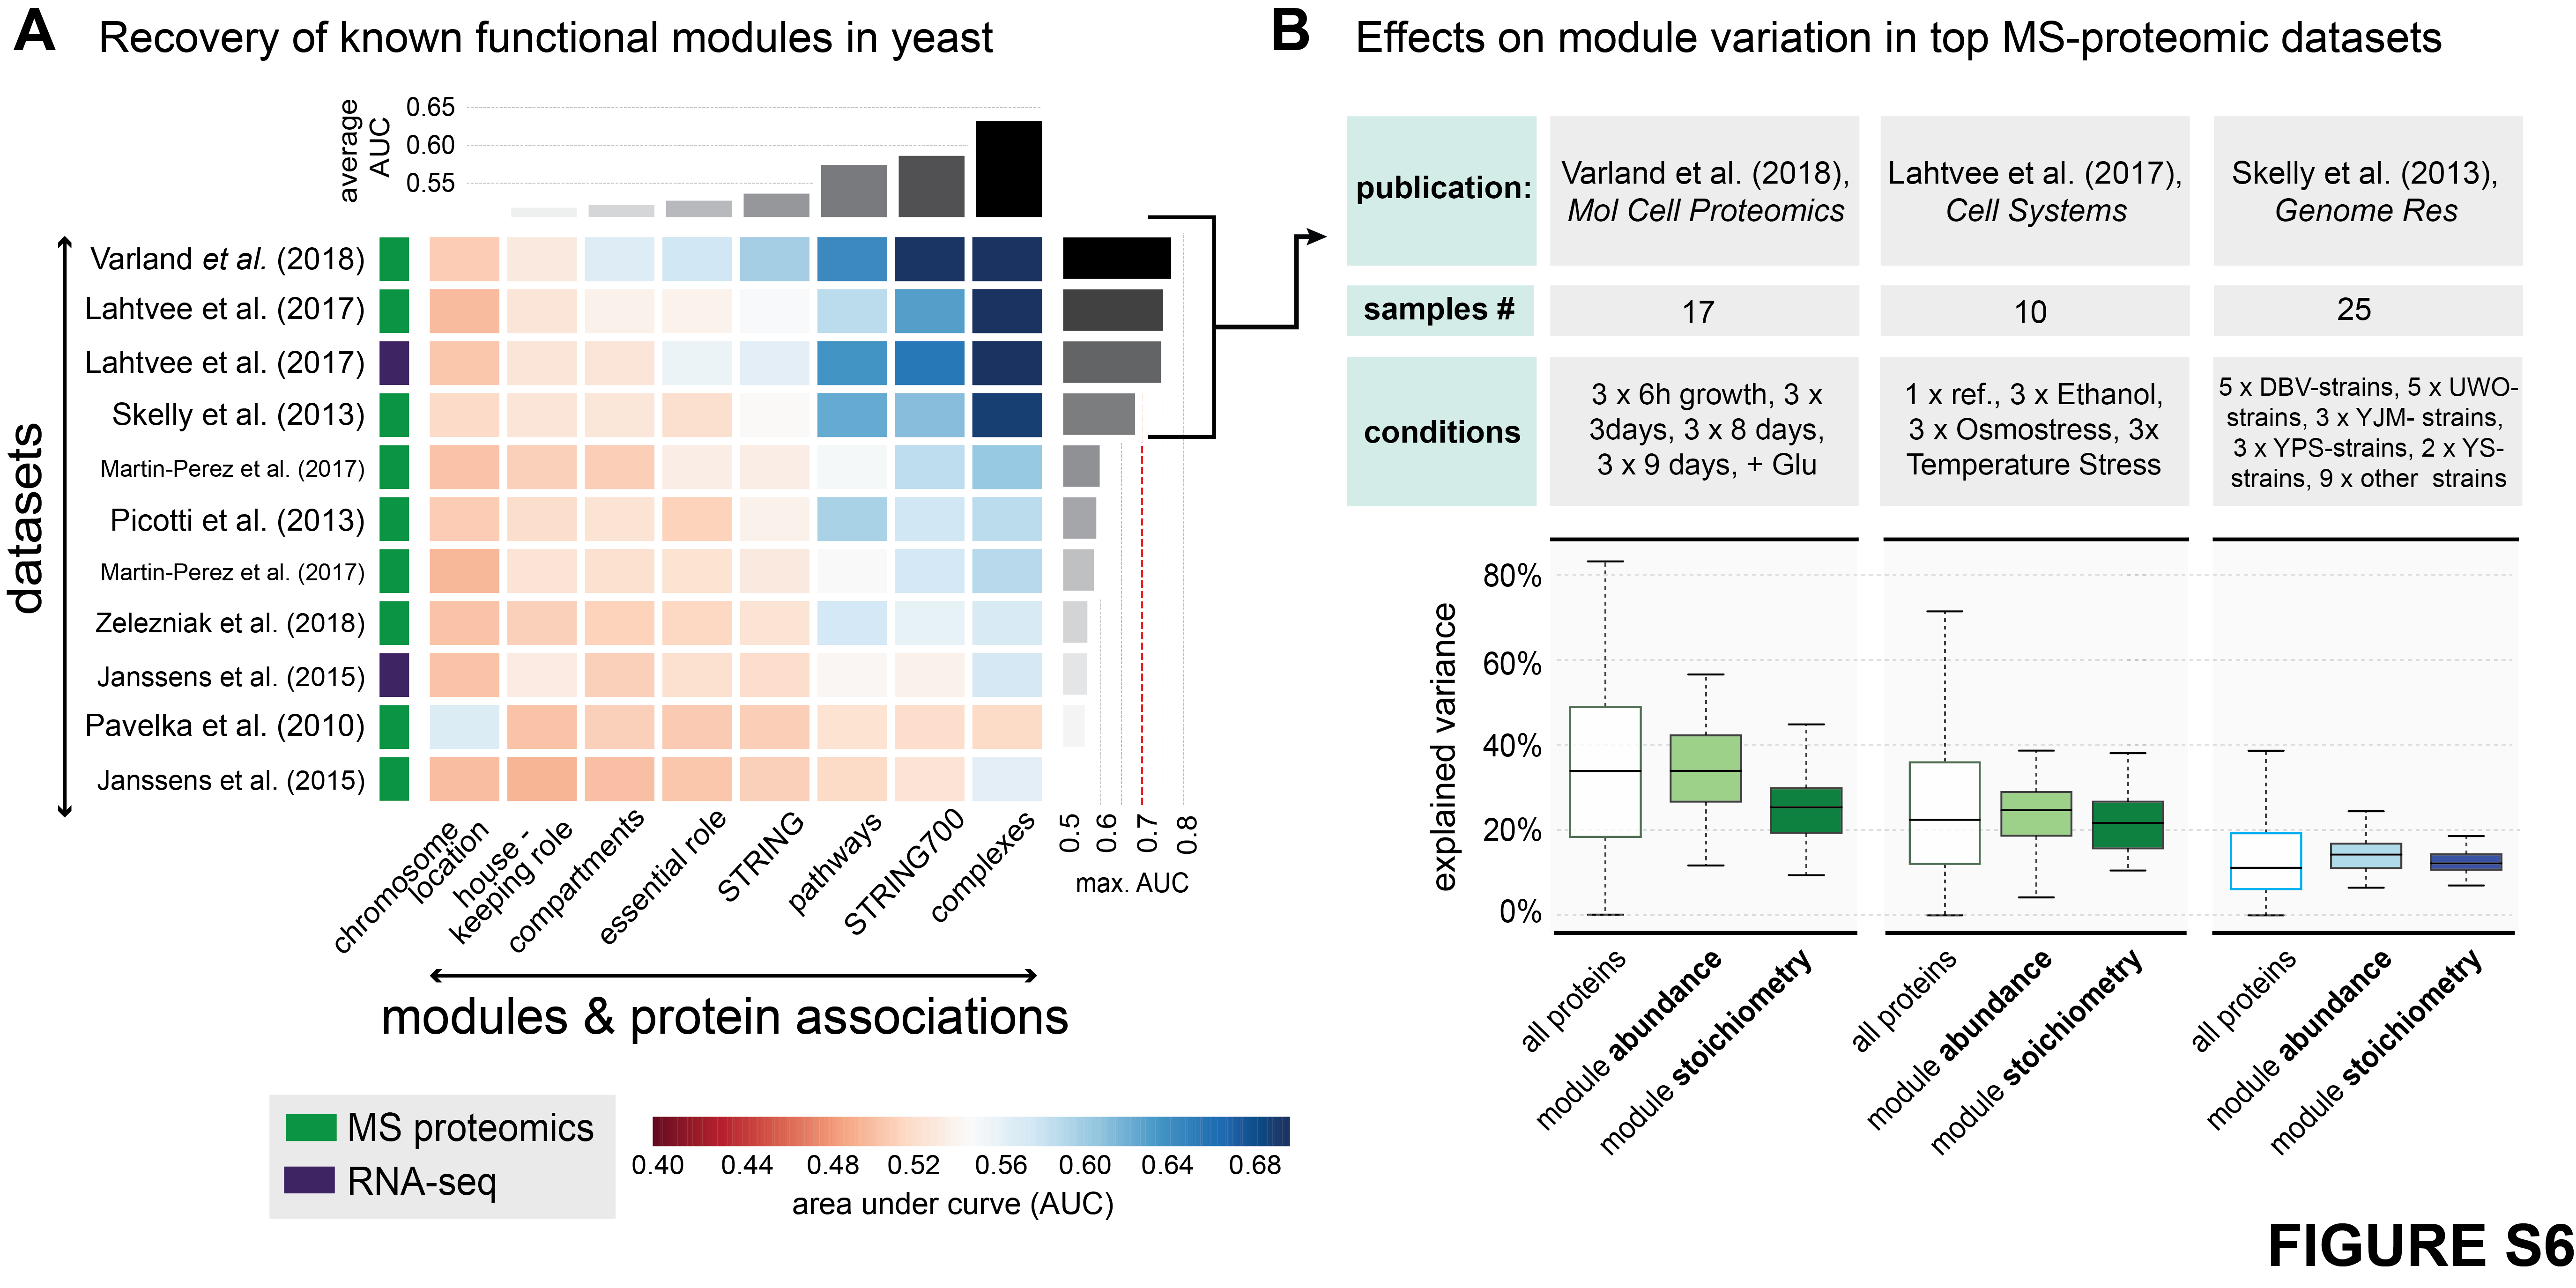
(A) Recovery of known functional modules by means of receiver operating characteristic (ROC)- analysis. Each cell of the matrix displays the AUC (area under curve) value for a given module (x-axis) in the given dataset (y-axis). Modules of protein associations are ordered according to respective average AUC. The type of data is indicated by the colored boxes next to the dataset. The datasets have been extracted from the following publications: (1) Varland et al. (2018), Mol Cell Proteomics; (2+3) Lahtvee et al. (2017), Cell Systems; (4) Skelly et al. (2013), Genome Res; (5 + 7) Martin-Perez et al. (2017), Cell Systems; (6) Picotti et al. (2013), Nature; (8) Zelezniak et al. (2018), Cell Systems; (9 + 11) Janssens et al. (2015), Elife; (10) Pavelka et al. (2010), Nature.
(B) Table displaying details for relevant publications, sample numbers, and conditions. On the left-hand side the distribution of the overall effect of environment (green) and genetic (blue) on protein abundance variation (all proteins), as well as abundance and stoichiometry variation of modules, including protein complexes and pathways with highly co-varying protein members. The lighter colors correspond to effects on abundances, whereas darker colors corrrespond to effects on module stoichiometry.
This figure has been generated with the following code: suppFigure6_code
The underlying data can be found here.