Figure 4
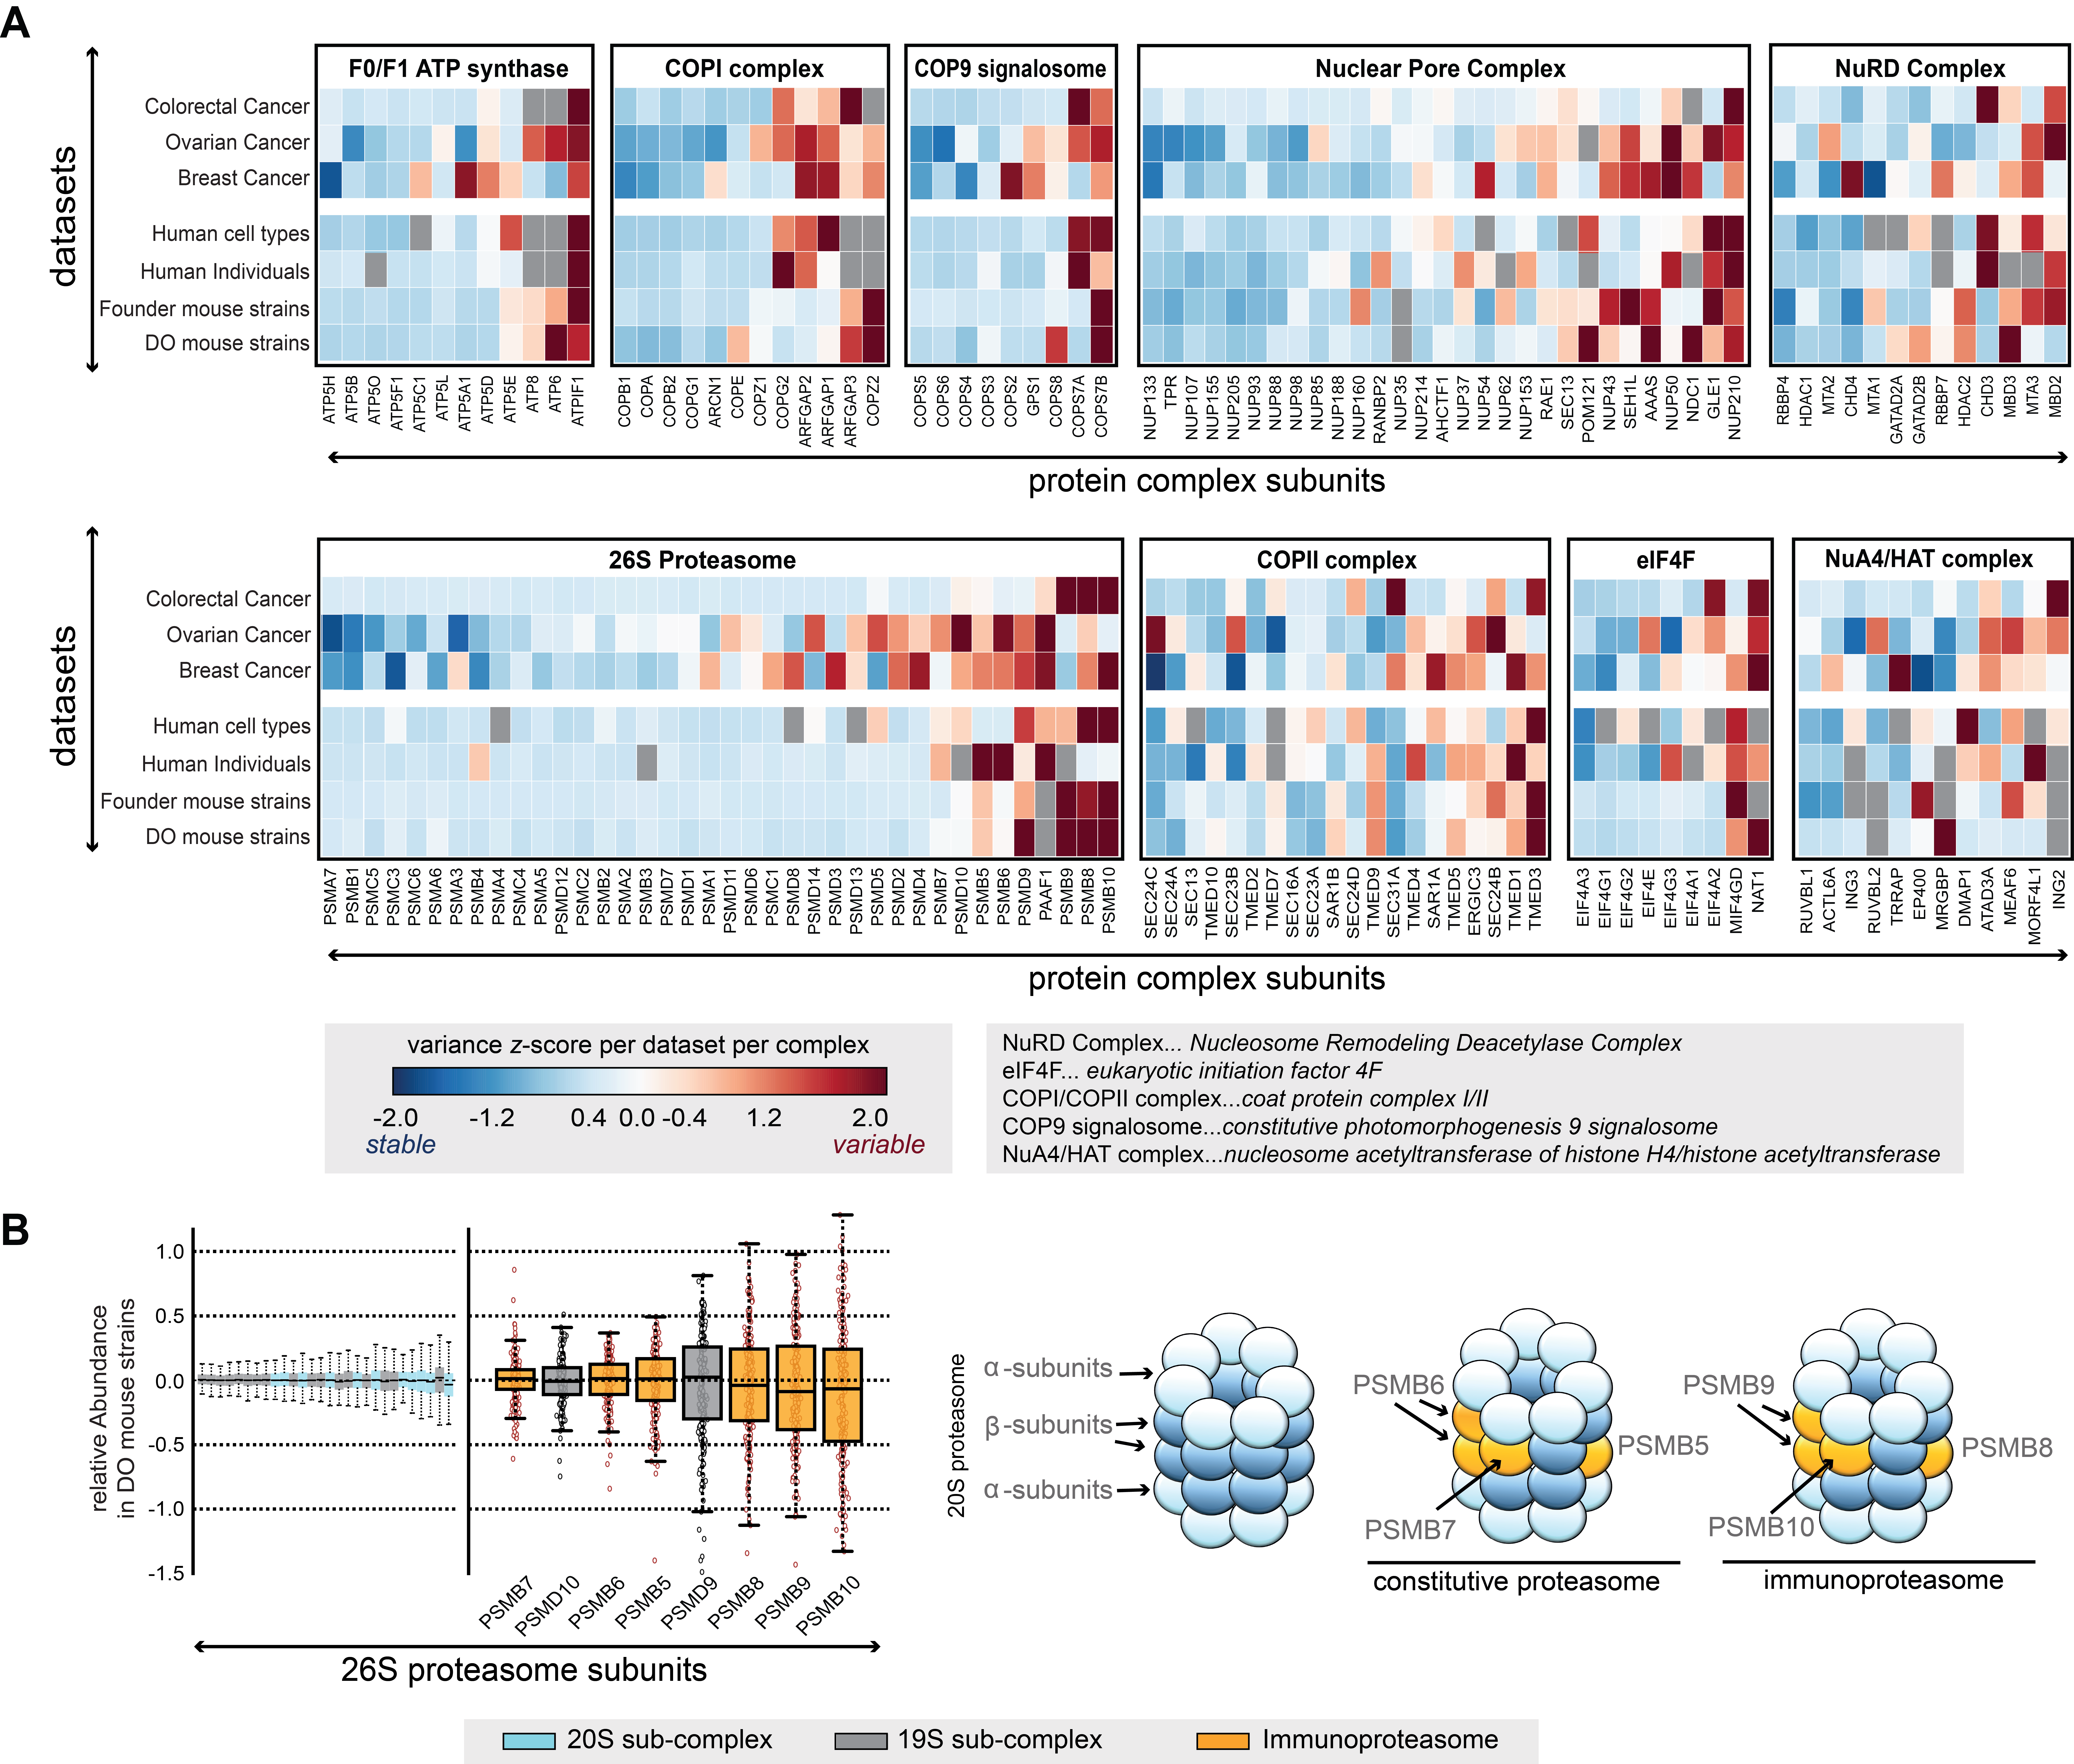
(A) Illustration of stable and variable components in a number of exemplary complexes (x-axis: protein complex subunits, y-axis: datasets). The heatmaps display z-scores, which were calculated based on protein variances following complex normalization (variable component (red): z-score > 1.5; stable component (blue): z-score < -1.5). If a given protein was not detected in a dataset the field is left out grey in the heatmap. Abbreviations of complex names are explained in the respective legend.
(B) Members of the immuno-proteasome make up the most variable part of the proteasome complex across individuals, in the displayed example across the diversity outbred (DO) mouse strains. The boxplots (left) display the complex-normalized protein abundances, with the color code highlighting the respective structural entities of the 26S proteasome as indicated in the right-hand cartoon (blue: 20S, grey: 19S, orange: immunoproteasome).
This figure has been generated with the following code: figure4_code
The underlying data can be found here.
